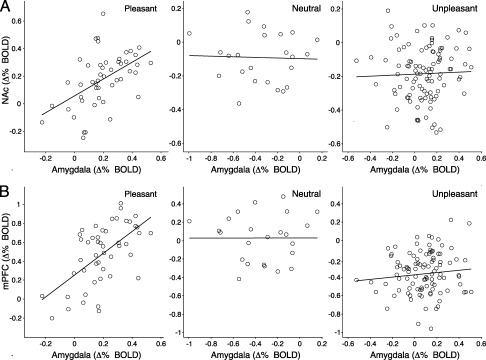
Figure 4.

Pleasure‐specific connectivity of the amygdala with NAc and mPFC. Scatter plots depict the correlation of mean BOLD activity during imagery (averaged over participants for each of the four time points following text presentation) in the amygdala with NAc (A) and mPFC (B), separately evaluated for pleasant, neutral, and unpleasant scenes.
