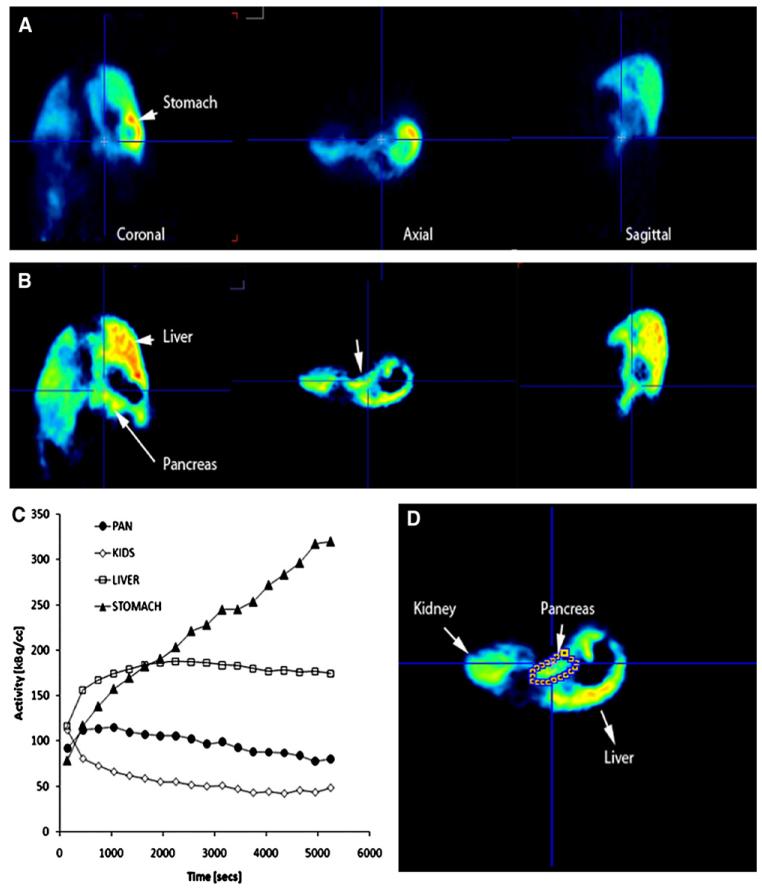
Fig 1.
Representative images from reconstructed PET scans with [11C] DTBZ in the GK rat. (A) Representative coronal, axial, and sagittal abdominal planes of a GK rat. The pancreas, stomach and liver are identified with arrows. Reconstructed images represent the PET data at the mid point of the entire scanning period. (B) Voxel-wise analysis of the radioligand kinetic history and parametric maps of the y-intercept values of each voxels time activity curve. Notice the disappearance of the stomach because of the lower y-intercept values of the average time activity curve. (C) Average time–activity curves (TAC) within the region of interest for [11C] DTBZ uptake during the study. The amount of [11C] DTBZ in kBq/cc versus the duration of the PET scan in seconds are plotted on the y and x axes, respectively. Solid triangles represent activity in the stomach, the open squares represents activity in the liver, solid circles represents the activity in the pancreas and open diamonds the activity in the cortex of the kidneys. (D) Region of interest definition of pancreas on an axial slice based on parametric maps (B) and anatomic location.

