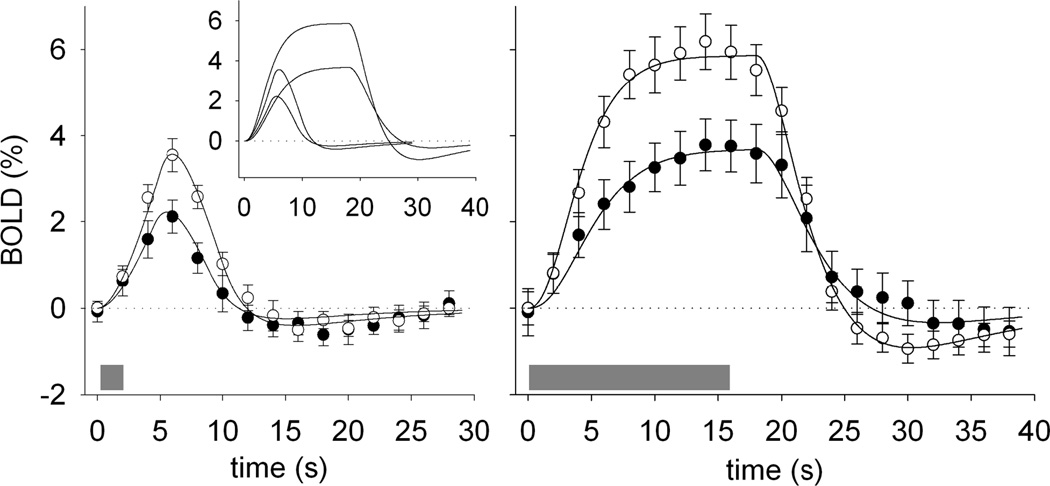
Figure 2.
BOLD responses to visual stimulation were diminished in children with SCA. The amplitude of the BOLD response to 2-s (left) and 16-s (center) visual stimulation was significantly lower in SCA patients (black circles) than in control patients (white circles) patients. The gray bars indicate the time of the visual stimulation, and the error bars show the standard error of the mean across subjects in each group. The solid curves in each plot are Balloon Model (Buxton et al., 2004) fits to approximate the BOLD responses for each condition Parameters for the 16 s stimulus are shown in the Table 2. The stimulation paradigm had four 30 s blocks in which stimulus was on for 2 s and three 40 s blocks in which the stimulus was on for 16 s. The small inset graph in the left panel shows the balloon model results for the short and long stimulus together and demonstrates the consistency of the BOLD response features across the conditions.

