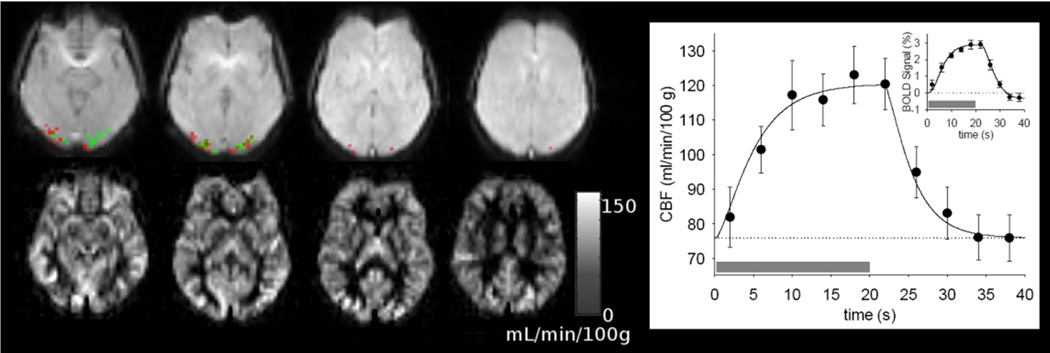
Figure 3.
CBF and visual activation detected with the ASL measurement for the SCA patient with the median activation volume. The images in the lower row are maps of baseline perfusion calculated from the ASL data. Images in the upper row show activation in the visual cortex detected by CBF change (green) and BOLD signal change (red) during stimulation. The graph on the right shows average CBF response to visual stimulation measured with ASL in SCA patients. The gray bars indicate the time of the visual stimulation, and the error bars show the standard error of the mean across the group. The solid curve in the CBF plot is a numerical approximation generated by filtering a rectangular function (supplementary online material). The small inset graph shows the BOLD response to visual stimulation estimated from the ASL data. The solid curve in BOLD signal plot is the Balloon Model fit to approximate the BOLD response. The stimulation paradigm had eight 40 s blocks with stimulus on for 20 s.

