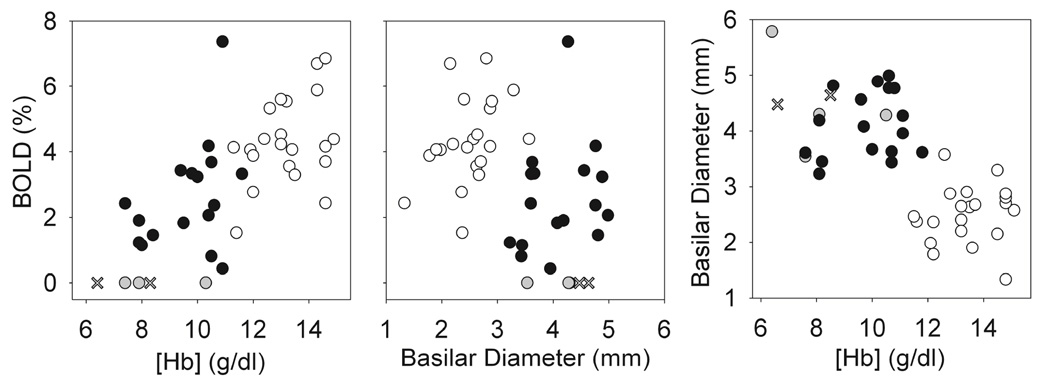
Figure 4.
The BOLD response and hematologic variables. The BOLD signal amplitude was significantly associated with both [Hb] (rs = 0.71, p < 0.00001) and basilar artery diameter (rs = −0.44, p = 0.004). Basilar artery diameter, an index of cerebral blood volume, was also inversely associated with [Hb] (rs = −0.69, p < 0.00001). SCA patients with detectable activation are indicated by black circles and control patients are indicated by white circles. The SCA patients without detectable activation are shown with gray circles, and × indicates the two patients who were not on hydroxyurea therapy. Graphs show the responses for the 2 s stimulus. Responses for the 16 s stimulus (not shown) were essentially the same as those shown for the 2 s stimulus. rs: Spearman’s correlation coefficient.

