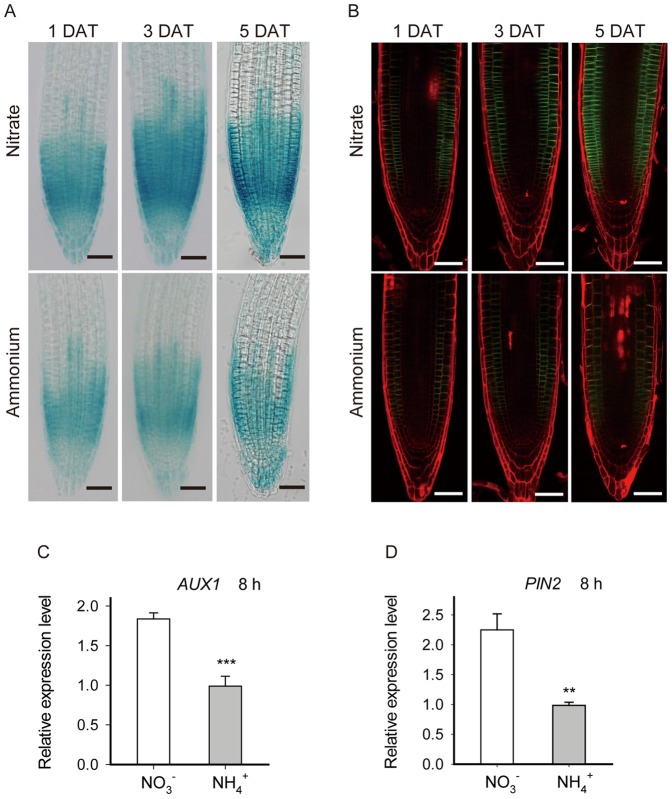
Figure 6. Expression of AUX1 and PIN2 is down-regulated in response to ammonium treatment.
(A) AUX1::GUS. Bright-field images of root tips are representative of 10–12 plants in three replicate experiments, treated as for Figure 1A, and taken at the indicated days after transfer (DAT). Bar = 50 µm. (B) PIN2::PIN2-GFP. Confocal fluorescence images of PI-stained root tips, representative of 9–12 plants in three replicate experiments. Seedlings were treated as in Figure 1A, and tested at the indicated days after transfer (DAT). Bar = 50 µm. (C) and (D), Relative gene expression level of (C) AUX1 and (D) PIN2 was determined by quantitative real-time PCR. Plants were treated as in Figure 1A. The apical 5 mm segments of primary roots were sampled 8 h after transfer. At least 102 to 108 seedlings from three replicate experiments were collected for total RNA extraction. Bars plot means ± SD.

