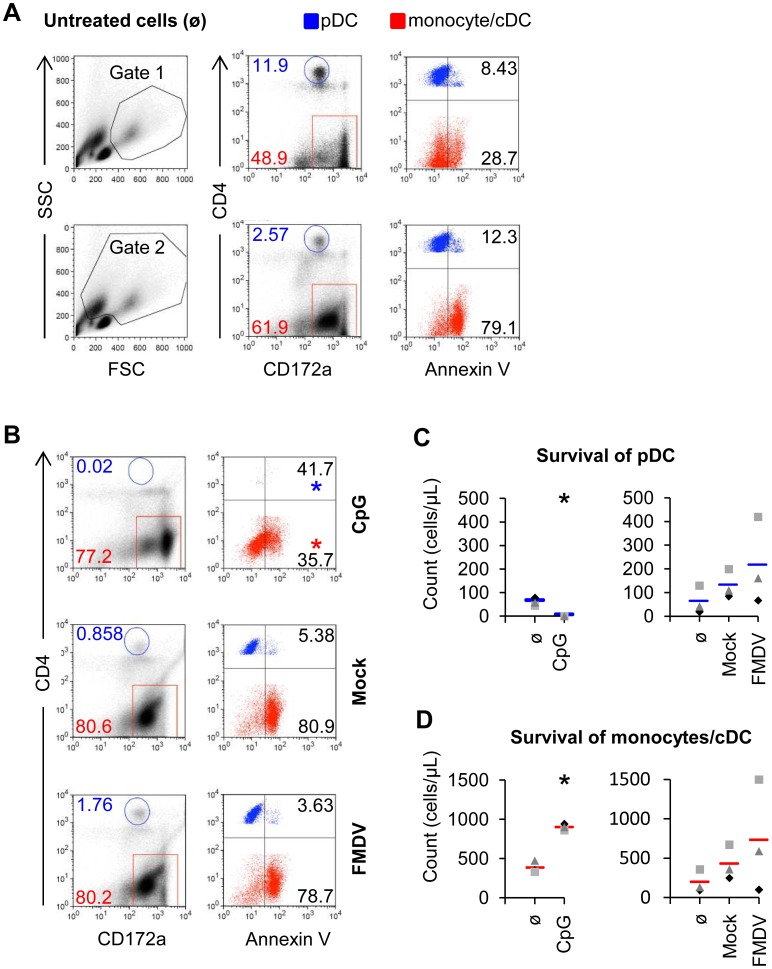
Figure 4. CpG but not FMDV deplete pDC population by inducing apoptosis.
CD172a+ sorted cells were untreated (A) or stimulated with 10 µg/ml of CpG for 16 h or FMDV for 24 h (B, C, D). A. Three-color FCM of CD4, CD172a and AnnexinV, with a CD4/CD172a dot plot defining the pDC gate (CD4highCD172alow) and the monocyte/cDC gate (CD4−CD172a+) after culture in medium. On the left side plot, putative live cells and live and dead cells were defined according to the FSC/SSC profile, excluding lymphocytes and cell debris. On the right side plots, the AnnexinV expression of the gated pDC (blue) and monocytes/cDC (red) with percentages are shown. B. Apoptosis of pDC and monocytes/cDC after stimulation with CpG, Mock antigen and FMDV. On the left side plot, pDC and monocytes/cDC with percentages were gated on live/dead cells as described in A. On the right side plot, the AnnexinV expression of the gated cell populations with percentages is shown after CpG or FMDV stimulation. C, D. Absolute number of pDC and monocytes/cDC on gated live cells after culture of enriched pDC with CpG, FMDV or only medium. Each marker represents results from one individual experiment and the bar represents the mean value. The asterisk indicates statistical significance between treated and non-treated cells (t-test, P<0.05).

