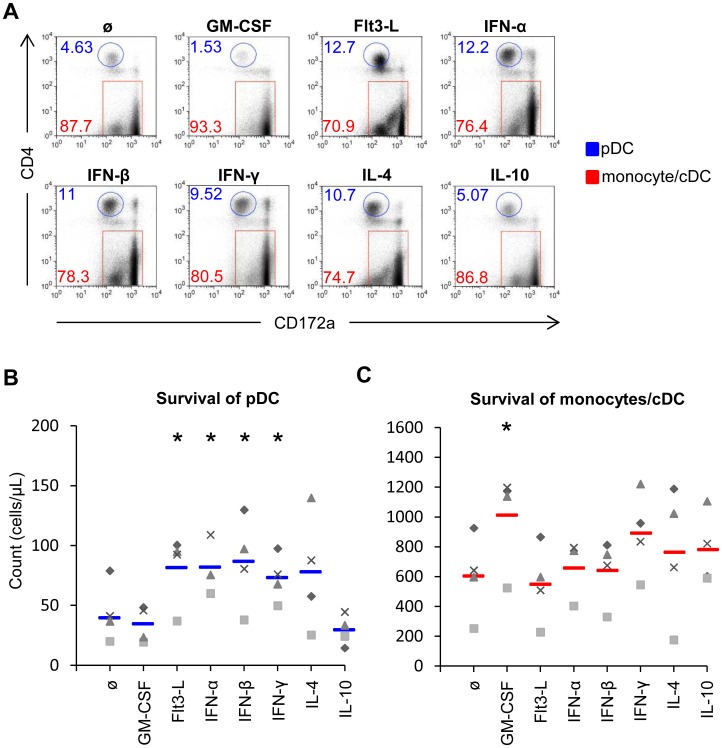
Figure 5. Impact of cytokines on pDC and monocytes survival.
Enriched pDC were cultured in presence of the indicated cytokines (concentrations as defined in Figure 2) for 16 h at 39°C. In A, the frequencies of pDC (blue) and monocytes/cDC (red) are shown on gated live cells. The plots are of a representative animal. In B and C, the survival of pDC and monocytes/cDC was determined on live cells. Each marker represents one individual culture of on animal and the bar the mean value. The asterisk indicates statistical significance between treated and non-treated cells (t-test, P<0.05).

