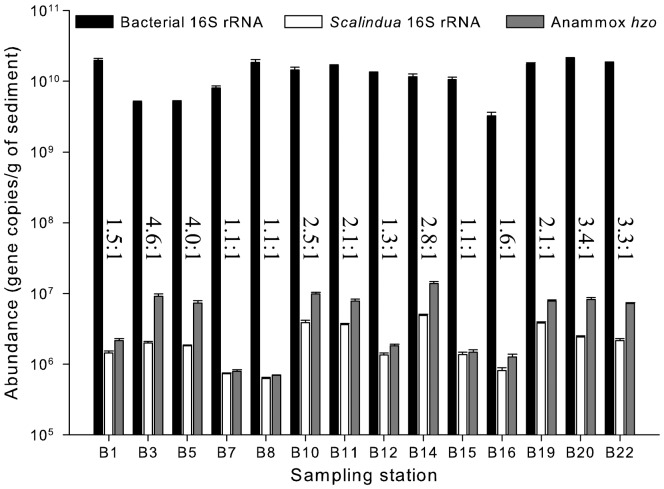
Figure 7. Abundances of the Bohai Sea sediment total bacteria, Ca. Scalindua bacteria and total anammox bacteria.
These data were determined via qPCR specific to the respective target genes. The means and standard errors were calculated with three replicate qPCR measurements. The numerical values in the graph show the ratios of the total anammox bacterial hzo gene abundance to the Ca. Scalindua bacterial 16S rRNA gene abundance at each specific sampling station.

