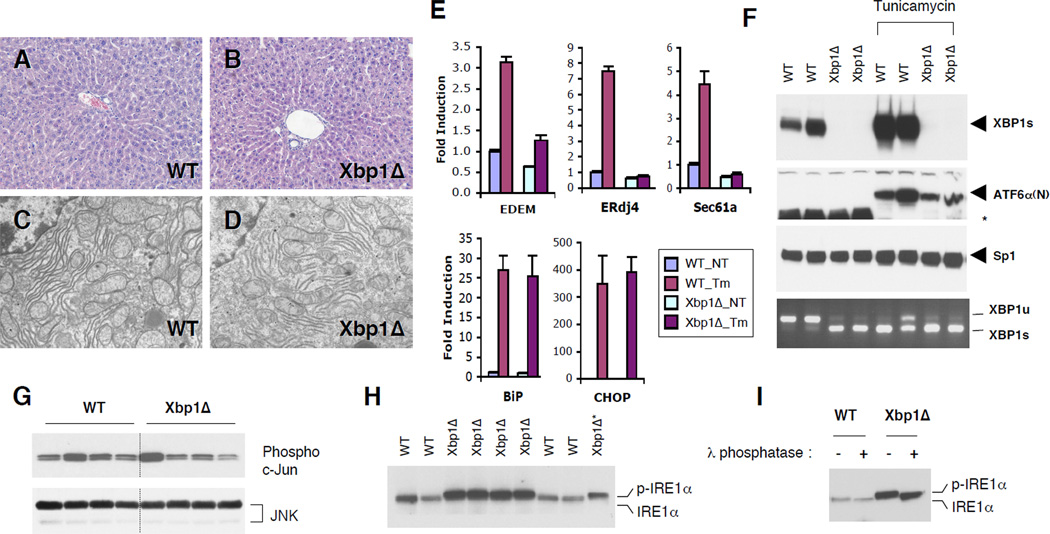
Figure 1. ER stress response in XBP1 deficient mouse liver.
(A and B) Hematoxylin and eosin staining of liver sections. (C and D) Transmission electron micrographs of WT and Xbp1Δ liver. (E) Total RNAs were prepared from the liver of WT and Xbp1Δ mice 8 hours after tunicamycin injection. Expression of representative UPR target genes were tested by quantitative real-time PCR analysis. Fold induction represents relative expression level ± SEM compared to that of untreated WT mice. N=4 per group (F) Western blot of nuclear XBP1s and the processed ATF6α(N) proteins. Sp1 expression is a loading control. Levels of IRE1α-mediated XBP1 mRNA (both WT and mutant) splicing were measured by RT-PCR. *non-specific band. G) Total and active JNK protein levels were determined by western blot and c–Jun kinase assay, respectively. (H) IRE1α was detected by immunoprecipitation followed by western blot with IRE1α antibody. One third of the Xbp1Δ immunoprecipitation product was loaded on the last lane for a better comparison of band migration. Phosphorylated IRE1α displayed slowed migration on the gel. (I) IRE1α immunoprecipitation products were treated with λ phosphatase. Western blot analysis shows a band shift upon phosphatase treatment.

