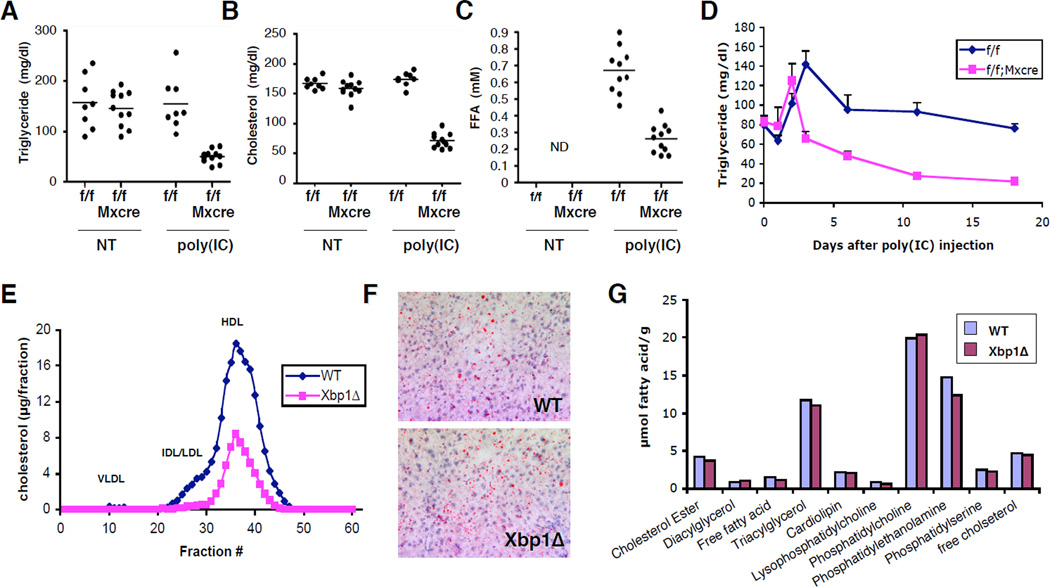
Figure 2. Plasma and hepatic lipid profiles of XBP1 deficient mice.
Xbp1f/f and Xbp1f/f;Mx1-cre mice were injected 3X with poly(I:C). Three weeks after the last injection, plasma TG (A), cholesterol (B), and serum free fatty acid levels (C) were measured. (D) Plasma TG levels were measured over time in mice that received a single injection of 250 µg of poly(I:C). Error bars represent SEM. N=6–7 (E) Distribution of plasma cholesterol was determined by FPLC separation of lipoprotein particles. (F) Fat content in the liver was determined by oil red O staining. (G) Lipid composition in the liver was determined by Lipomics analysis. N=4/group.

