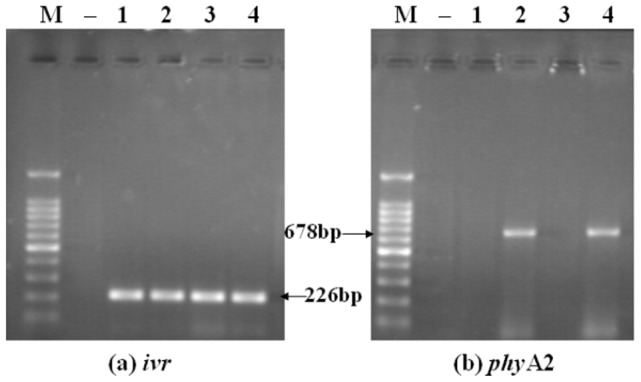
Figure 1. Fragmentation of DNA from control corn (CC) and phytase transgenic corn (PTC).

(a) The endogenous gene (226 bp) of corn for ivr (left), (b) The exogenous gene (678 bp) of PTC for phyA2 (right). Arrows indicate the expected length of PCR products. M = marker; Lanes 1 = CC; lanes 2 = PTC; Lanes 3 = CC diet; lanes 4 = PTC diet; − = negative control (no DNA).
