
Figure 2. GATA3 reduces effectors in the TGFß1 pathway in MB-231 cells.
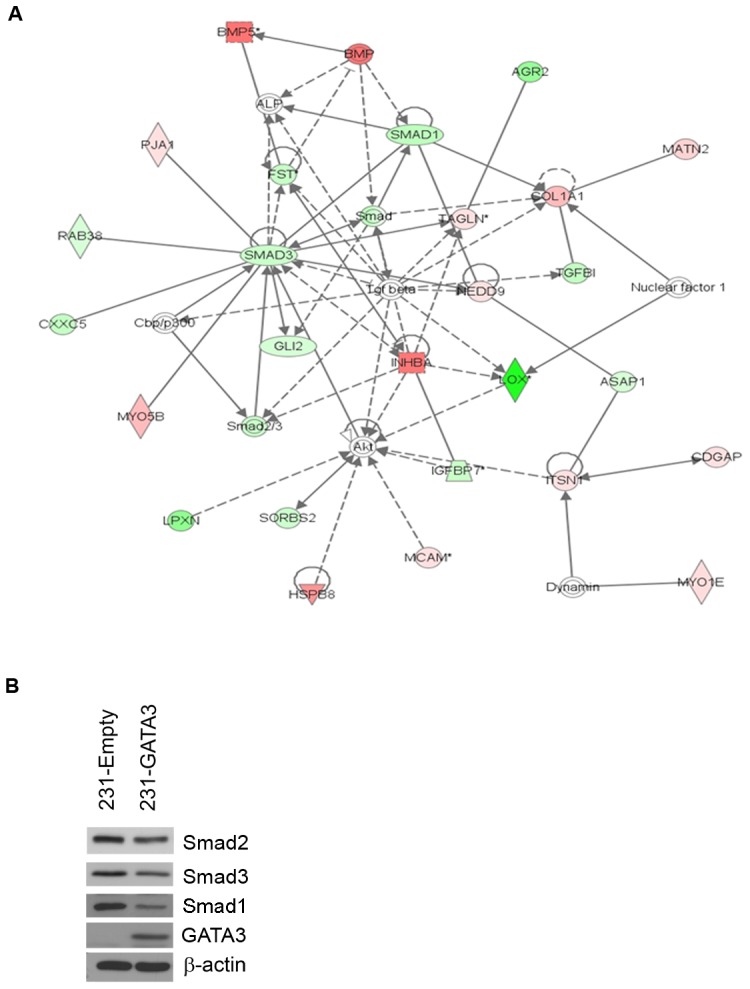
(A) Ingenuity network analysis of 231-Empty vs. 231-GATA3 cells. Genes that were differentially expressed in 231-Empty vs. 231-GATA3 cells (p<0.001, fold change >1.5) were input into Ingenuity Pathway analysis. One of the top networks identified demonstrated changes in several TGFß1 effectors. (B) Western blot of 231-Empty and 231-GATA3 cells validating changes in expression of Smad2, Smad3 and Smad1 between 231-Emtpy and 231-GATA3 cells.