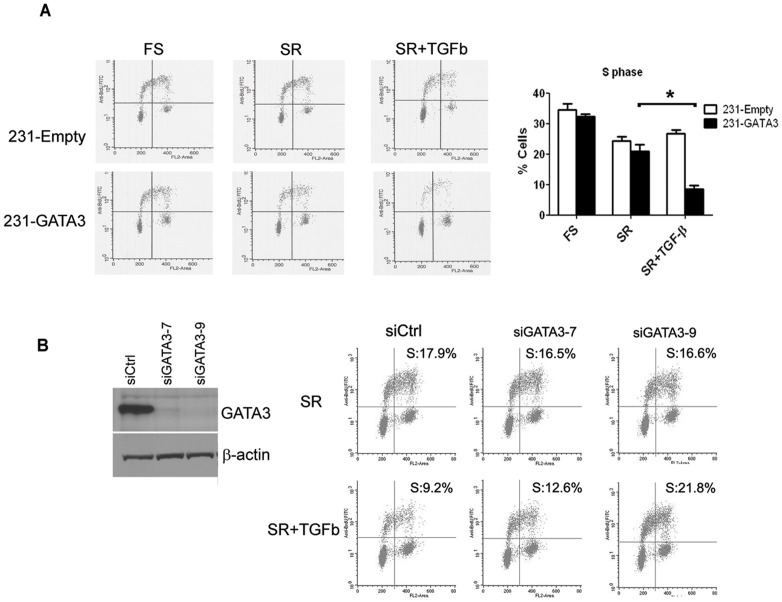
Figure 4. GATA3 confers growth inhibitory response to TGFß1 in MB-231 cells.
(A) Flow cytometric analysis of 231-Empty and 231-GATA3 cells grown in full serum, SR (serum replacement) or SR +TGFß for 24 hrs. 231-GATA3 cells show a reduction in %S-phase cells upon TGF-ß1 treatment compared to SR conditions whereas 231-Empty cells continue to proliferate with TGF-ß1 treatment. (B) Western blot analysis of GATA3 downregulation by siRNA and flow cytometric analysis of TGFb effect in control or GATA-3 siRNA transfected cells. Percentage of cells in S-phase is provided on each panel.

