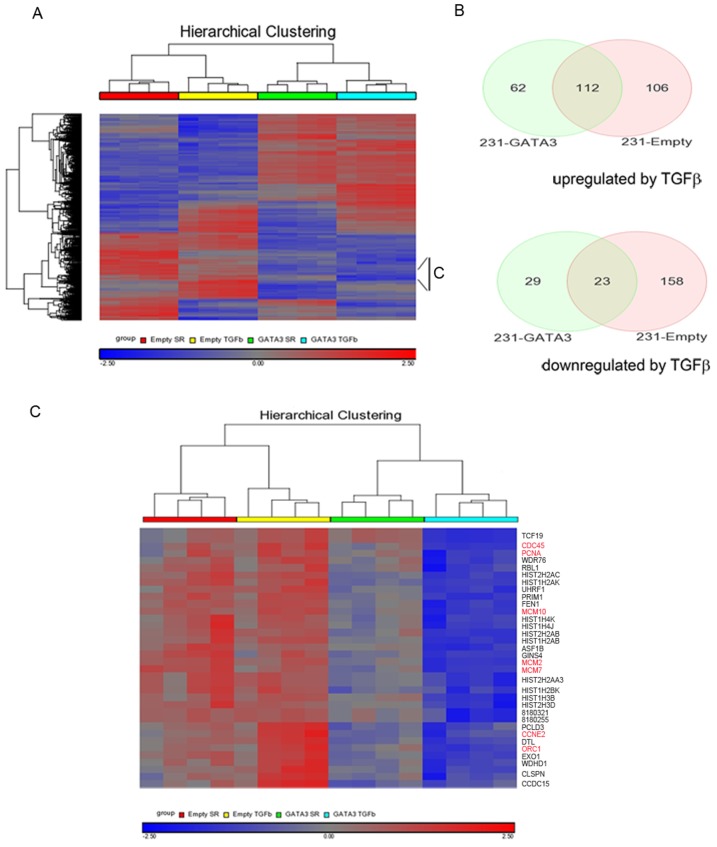
Figure 5. Microarray analysis of 231-Empty and 231-GATA3 cells in response to TGF-ß1.
(A) Unsupervised hierarchical clustering analysis of 231-Empty and 231-GATA3 cells with or without TGFß1 treatment for 24 hrs. The displayed expression of each gene was standardized within the respective datasets (gene-z-score transformation for the 4 treatment groups). The black bar shows genes in panel C below. (B)Venn diagram of genes that show >1.6 fold difference and p<0.001 in response to TGFß1 in 231-Empty and 231-GATA3 cells. (C) Expanded cluster from indicated region in (A) showing changes in genes associated with cell cycle regulation.

