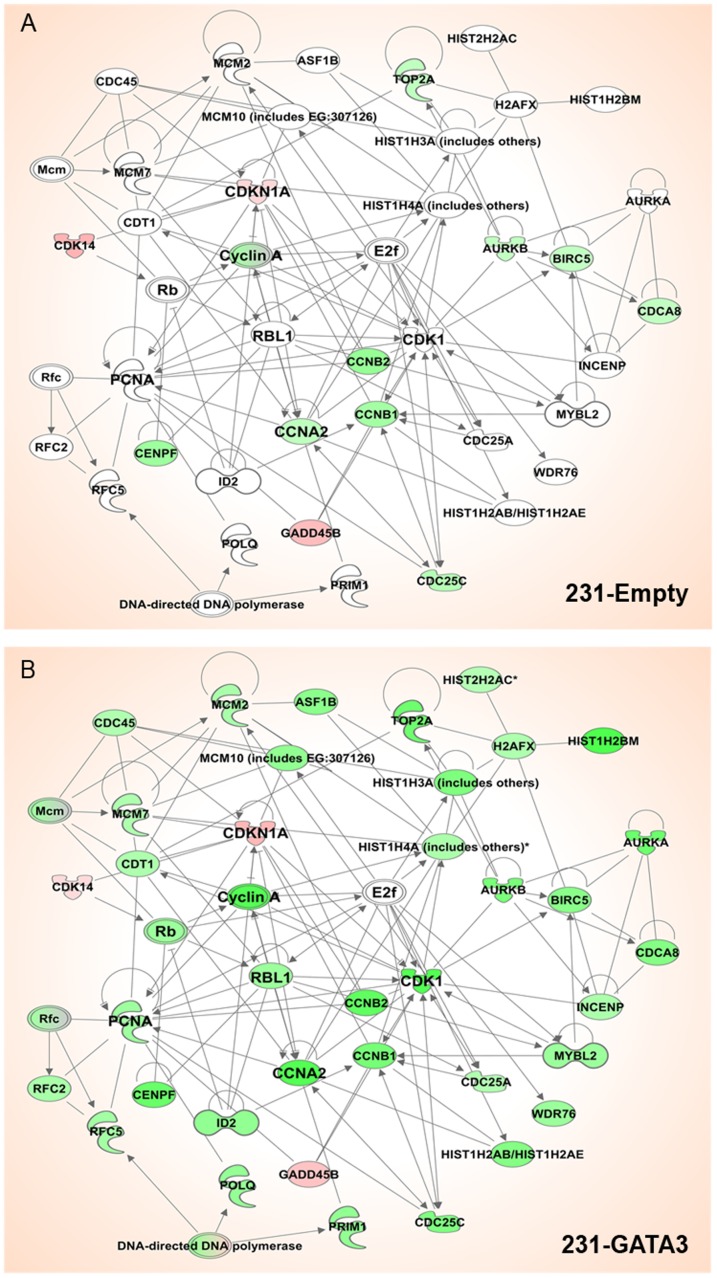
Figure 6. Network of genes involved in cell cycle regulation.
Network of genes that were differentially expressed between 231-Empty and 231-GATA3 by >1.5 fold and p<0.001 (Ingenuity Pathway Analysis). Green represents reduced gene expression upon TGFß1 stimulation compared to untreated cells and red represent increased gene expression compared to untreated cells. Intensity of the color represents the degree of change for (A) 231-Emtpy cells and (B) 231-GATA3 cells. Many more genes in this network are downregulated by TGFß1in 231-GATA3 cells compared to 231-Empty cells.

