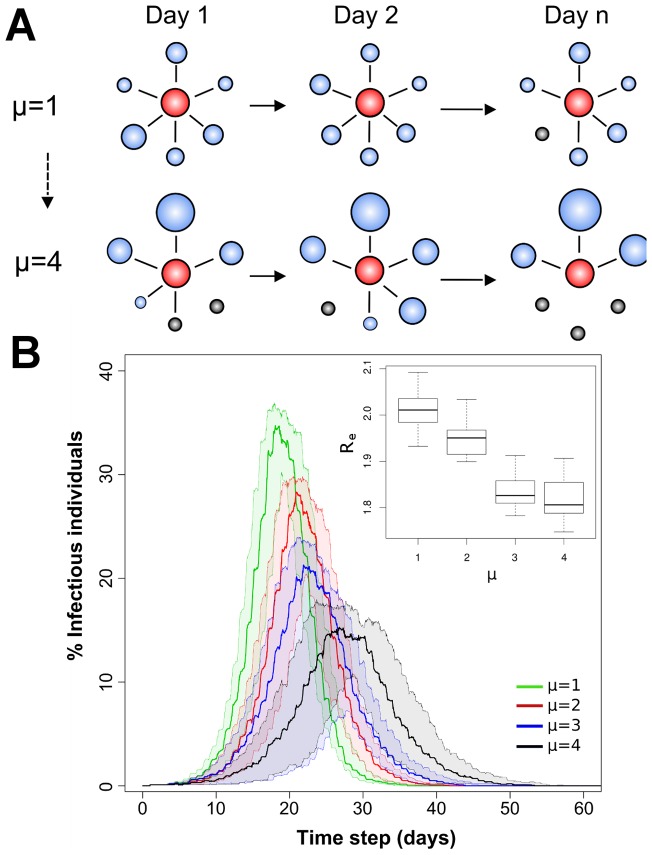
Figure 5. Impact of variable mobility routines on infectious disease dynamics.
(A) Diagram outlining the parameter µ from the individual-based model. Red bubbles indicate individuals whereas grey bubbles the locations that belong to their mobility routine. The larger the size of a bubble the more time an individual spent on a location. Some locations may not be visited every day. Individuals who visit and allocate their time into multiple locations have an unstructured routine (μ = 1) whereas individuals who every day spend a significant proportion of their time at one or very few locations have structured routines (μ = 4). (B) Epidemic curve and mean reproductive number (Re) for various scenarios simulating the transmission of an influenza-like pathogen within an Iquitos neighborhood. Models accounted for different levels of structure on an individual’s daily routine (from μ = 1 to μ = 4). Confidence bounds were calculated from 50 simulations performed under each scenario.

