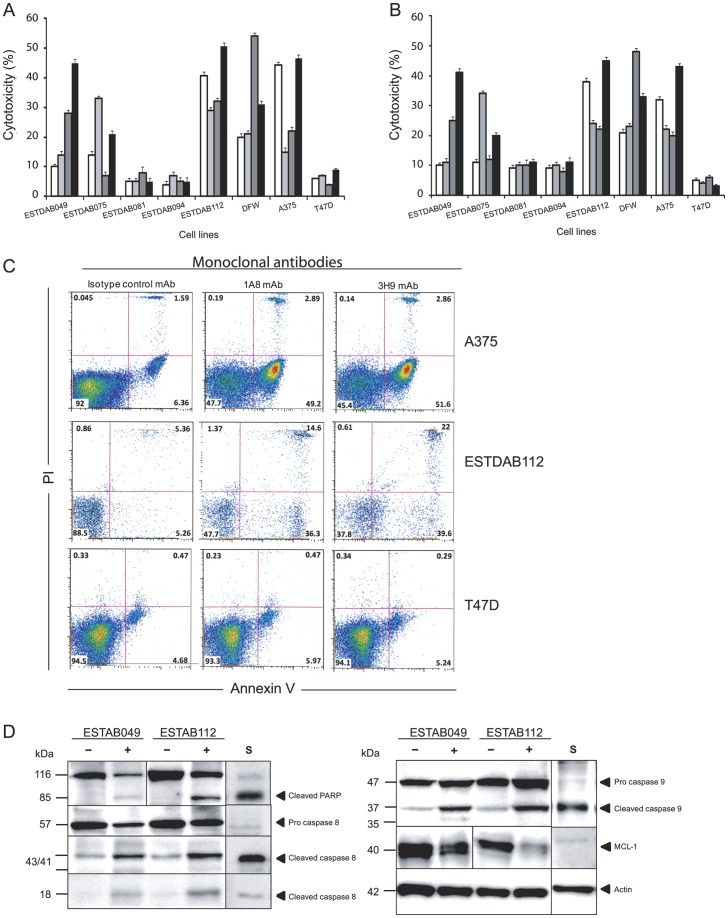
Figure 2. Induction of apoptosis in melanoma cells using anti-ROR1 mAbs.
Frequency (%) of apoptotic/necrotic cells in Annexin-V+/PI+ (A) and XTT cytotoxicity assay (B) induced by anti-ROR1 mAbs in the absence of complement or immune effector cells [anti-ROR1 mAb clones 1A8 (□), 1E9 ( ) and 5F1 (
 )3H9 (▪)]. Dot plot diagrams of apoptosis induced by anti-ROR1 mAbs (clones 1A8 and 3H9) in melanoma cells and ROR1 negative cell line T47D (Annexin-V/PI) (C). Western blot for cleaved PARP, caspase 8, 9 and MCL-1 expression in apoptotic ESTDAB049 and ESTDAB112 cells induced by the anti-ROR1 mAb clone 5F1 (D). (−) cells treated with a non-relevant isotype control mAb (mouse IgG1 isotype). (+) cells treated with the anti-ROR1 mAb clone 5F1. (S) cells treated with staurosporine.

