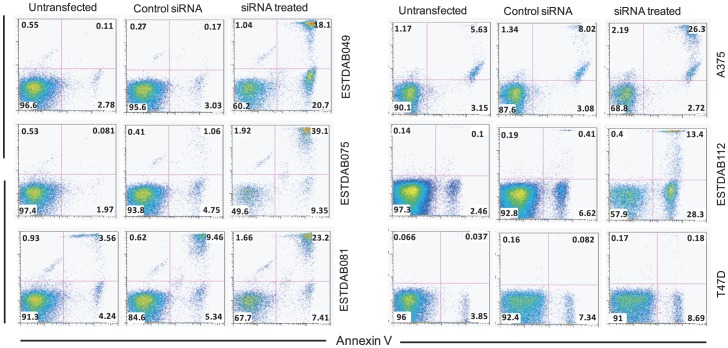
Figure 6. Apoptosis of melanoma cells treated with siROR1.
Dot plot (frequency) of apoptotic/necrotic melanoma cells (Annexin-V+/PI+) treated with siRNA, control siRNA and untreated. Within each quadrant the frequency of apoptotic cells is shown. Results are presented for the ESTDAB049, ESTDAB075, A375, ESTDAB112 (sensitive to apoptosis by anti-ROR1 mAbs) and ESTDAB081 (resistant to apoptosis by anti-ROR1 mAbs), The cell lines T74D cell line was used as a ROR1 negative control.

