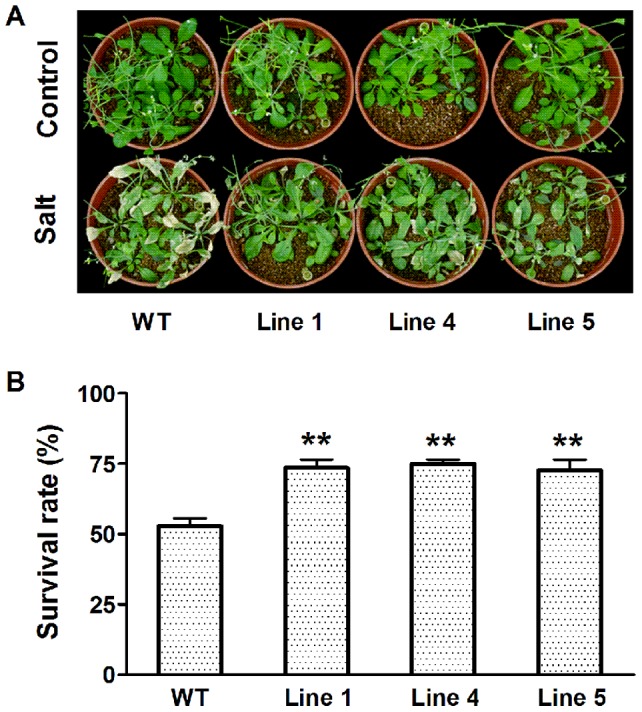
Figure 6. Effect of salt stress on wild-type and transgenic plants.

Phenotypes of wild-type and transgenic plants after treatment with NaCl for 14 days were shown in panel A. Survival rates were counted after recovery of watering for 7 days (panel B). Data are mean±SE with three replicates. Asterisks represent statistically significant differences between wild-type and transgenic lines. * P≤0.05, ** P≤0.01.
