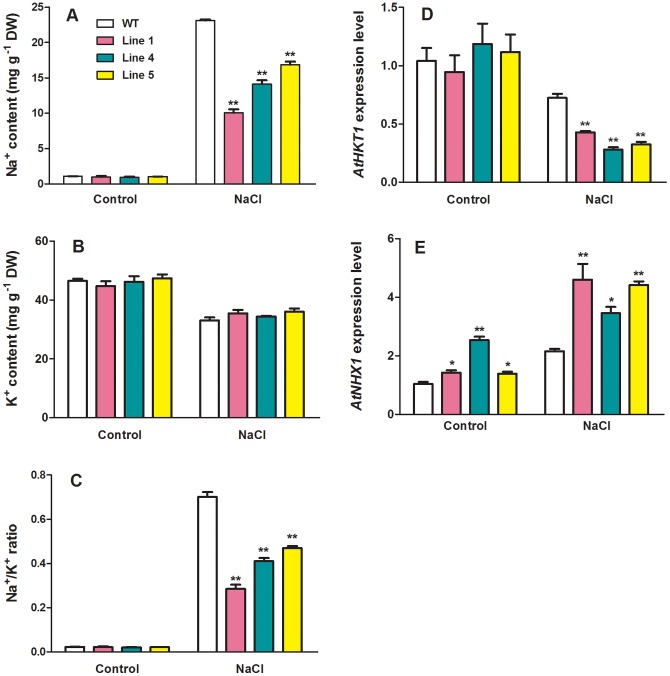
Figure 9. Effect of NaCl on contents of Na+ and K+, and expression of AtHKT1 and AtNHX1.
Contents of Na+ and K+ in shoots of wild-type and transgenic plants treated with and without NaCl were shown in panel A and B, respectively. Na+/K+ ratio was shown in panel C. The expression levels of AtHKT1and AtNHX1 were shown in panel D and E, respectively. Four-week-old seedlings irrigated with or without 200 mM NaCl for 6 days were tested in this experiment. Data are mean±SE with three replicates. Asterisks represent statistically significant differences between wild-type and transgenic lines. * P≤0.05, ** P≤0.01.

