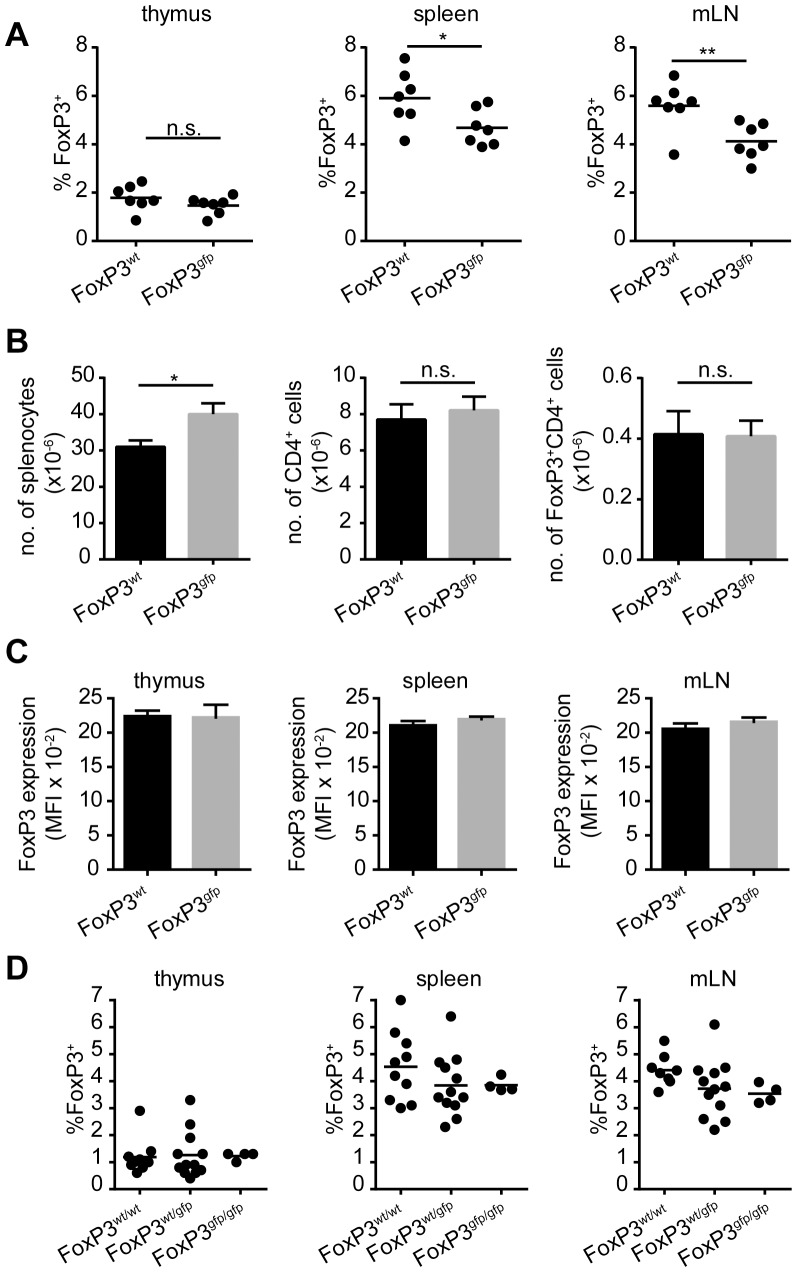
Figure 1. Young Tg4 FoxP3gfpmice have unaltered levels of FoxP3 expression.
A. FoxP3 expression by CD4+CD8− thymocytes or CD4+ cells from the spleen and mesenteric lymph nodes of male Tg4 FoxP3wt and Tg4 FoxP3gfp mice aged 5–7 weeks, directly ex vivo. Horizontal bar indicates mean. * p = 0.0329, ** p = 0.0084, n.s. = not significant. 2-tailed, unpaired student's t test, n = 7 each. B. Total number of splenocytes, CD4+ T cells and FoxP3+CD4+ Treg cells in the spleen of male Tg4 mice aged 5–7 weeks. Data displayed as mean, error bar indicates SEM. n = 3 each, * p = 0.0108, n.s. = not significant. 2-tailed, unpaired student's t test. C. Mean fluorescence intensity of FoxP3 staining in Treg cells in the thymus, spleen and mLN of 5–7 week old male Tg4 mice. Data displayed as mean, error bar indicates SEM. n = 3 each, no statistical difference, unpaired, 2-tailed student's t test. D. Frequency of FoxP3 expression on CD4+CD8− thymocytes or CD4+ cells from the spleen or mLN of Tg4 FoxP3wt/wt, Tg4 FoxP3wt/gfp or Tg4 FoxP3gfp/gfp females aged 5–8 weeks. FoxP3wt/wt n = 8, FoxP3wt/gfp n = 12, FoxP3gfp/gfp n = 4. No statistically significant differences, Tukey's multiple comparison test.

