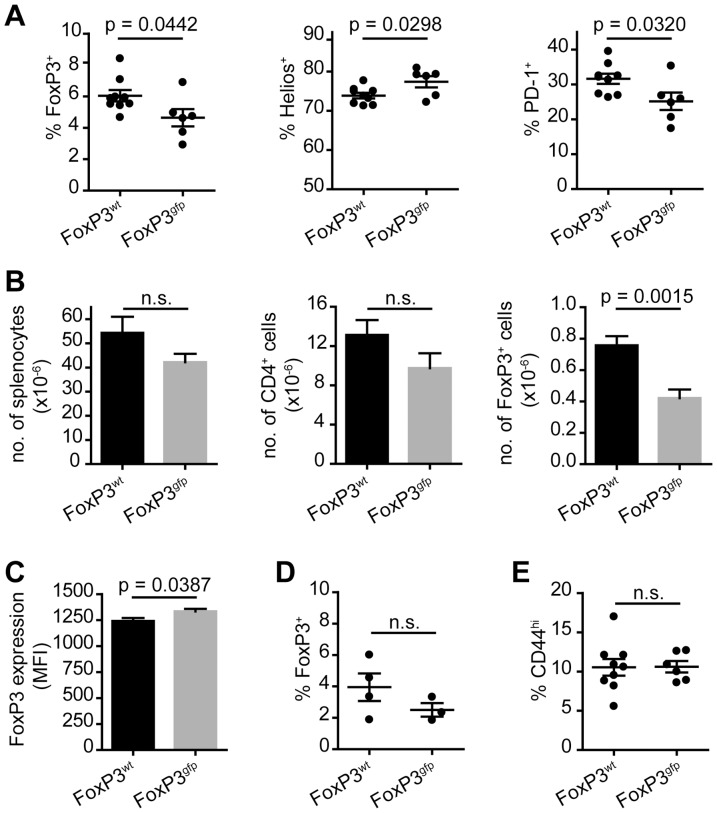
Figure 3. Lower number of peripheral FoxP3+ Treg cells in aged Tg4 FoxP3gfp males.
A. Frequency of FoxP3 expressing CD4+ T cells in the spleen of Tg4 FoxP3wt and Tg4 FoxP3gfp males aged 16–24 weeks (left) and the frequency of Helios and PD-1 expression gated on CD4+FoxP3+ splenocytes (middle and right). FoxP3wt n = 9, FoxP3gfp n = 6. Data represented as individual scores, with mean±SEM. B. Total number of splenocytes, CD4+ T cells or CD4+FoxP3+ Treg cells in the spleen. FoxP3wt n = 9, FoxP3gfp n = 6. Data represented as mean + SEM. C. Mean fluorescence intensity of FoxP3 staining in Treg cells in the spleen. FoxP3wt, n = 9, FoxP3gfp n = 6. Data represented as mean+SEM. D. Frequency of Foxp3 expression by CD4+ cells in the mLN. FoxP3wt n = 4, FoxP3gfp n = 3. Data represented as individual scores, with mean±SEM. E. Percentage of CD44hi CD4+ T cells in the spleen. FoxP3wt n = 9, FoxP3gfp n = 6. Data represented as individual scores, with mean±SEM. P values represent significance determined by 2-tailed, unpaired student's t test. n.s. = not significant.

