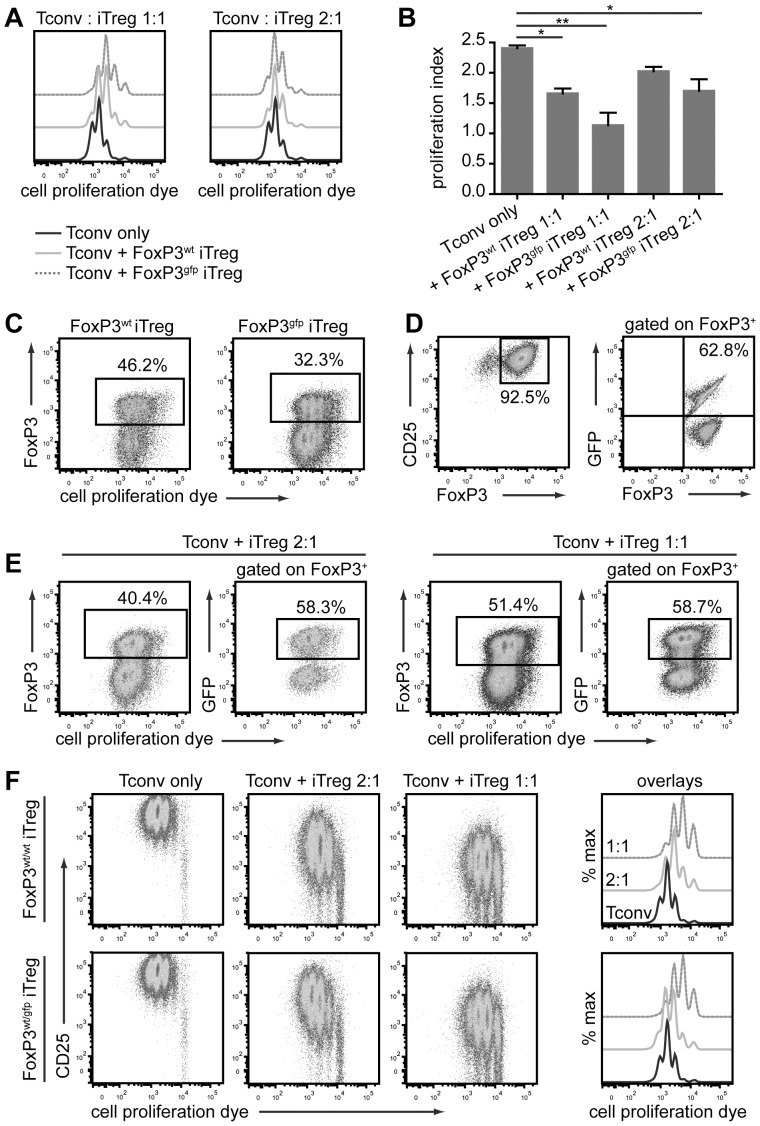
Figure 5. Tg4 FoxP3gfp iTreg cells are suppressive but unstable in vitro.
A. Representative histograms of cell proliferation dye dilution in labeled CD45.1+ naive CD4+ T cells cultured for 3 days with/without Tg4 FoxP3wt or Tg4 FoxP3gfp iTreg cells at a 1∶1 or 2∶1 ratio and stimulated with 10 µg/ml MBP Ac1-9. One representative of three identical experiments in triplicate. B. Proliferation index of naive CD4+ cells after 72 h co-culture with/without iTreg cells. Means of 3 identical experiments carried out in triplicate. * p < 0.05, ** p < 0.001, Tukey's multiple comparison test. C. Frequency of FoxP3 expression and proliferation of CD45.2+ iTreg cells after 3-day co-culture with naive CD45.1+ CD4+ T cells. One experiment representative of three carried out in triplicate. Gated on live CD45.2+ CD4+ T cells. D. Purity of FoxP3+ CD4+CD25+ Tg4 FoxP3wt/gfp iTreg cells and frequency of GFP expression therein, prior to in vitro co-culture with naive T cells. E. Proliferation and FoxP3 retention of CD45.2+ Tg4 FoxP3wt/gfp iTreg cells as well as frequency of GFP expression among CD45.2+ FoxP3+ cells after 3-day co-culture with naive CD45.1+ CD4+ T cells. F. CD25 expression and cell proliferation dye dilution in naive CD45.1+ CD4+ T cells after 72-h in vitro co-culture with CD45.2+ Tg4 FoxP3wt/wt or Tg4 FoxP3wt/gfp iTreg cells at different ratios. Proliferation dye dilution displayed as dot plot versus CD25 expression, or off-set histogram overlays. D-F. One experiment representative of 3 identical experiments.

