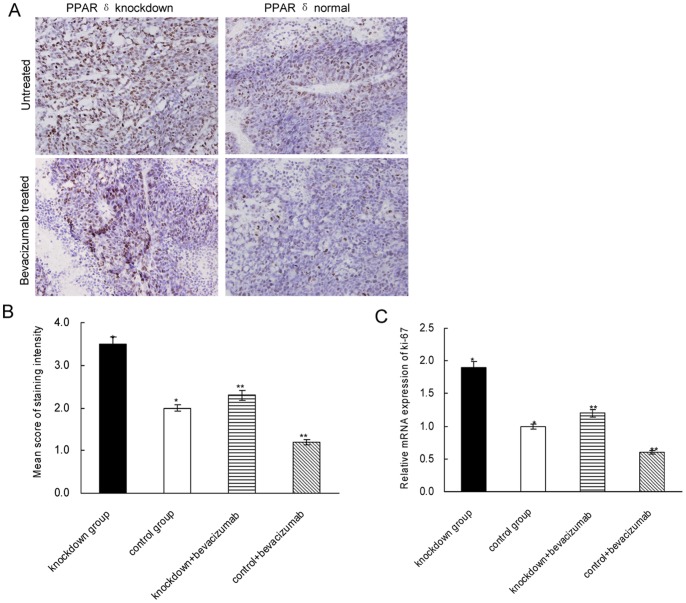
Figure 3. The expression of Ki67 in xenografts.
(A). Representative photographs of Ki67 expression in xenografts stained by IHC.×400 magnification. (B). PPAR δ- silenced group (n = 12) had significantly higher score of Ki67 staining than control group (n = 12) (*P = 0.026), even after treated by bevacizumab (**P = 0.031) (mean±SD; t test). (C). The mRNA level of Ki67 was significantly higher in PPAR δ-silenced group than in control group (*P = 0.018), even after treated by bevacizumab (**P = 0.025).

