
Figure 2. Feedback loop and global bias of Model A.
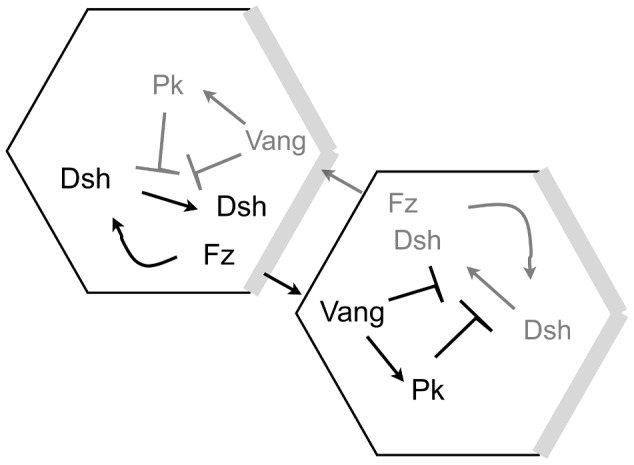
The amounts of proteins in black are higher than the amounts of proteins in grey. Arrows represent recruitment of proteins, T-signs inhibition. The grey regions at the distal sides of the cell indicate where the persistent global bias affects the dissociation rate of Dsh. This figure was reproduced from Fig 2B in [7].