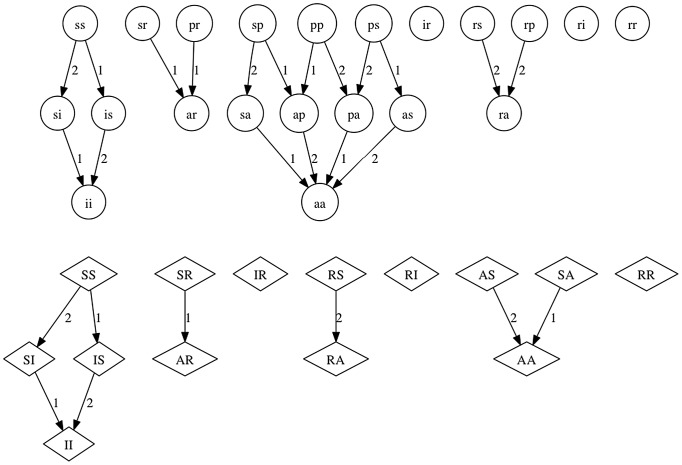
Figure 1. Transmission graphs for the mechanistic model.
Each fawn class is represented by a circle with two small case letters giving the status with respect to serotypes 1 and 2. Similarly, doe classes are represented by diamonds with two large case letters. Arrows represent possible changes of state due to infection events. Arrows are numbered 1 and 2 to represent the infecting serotype.

