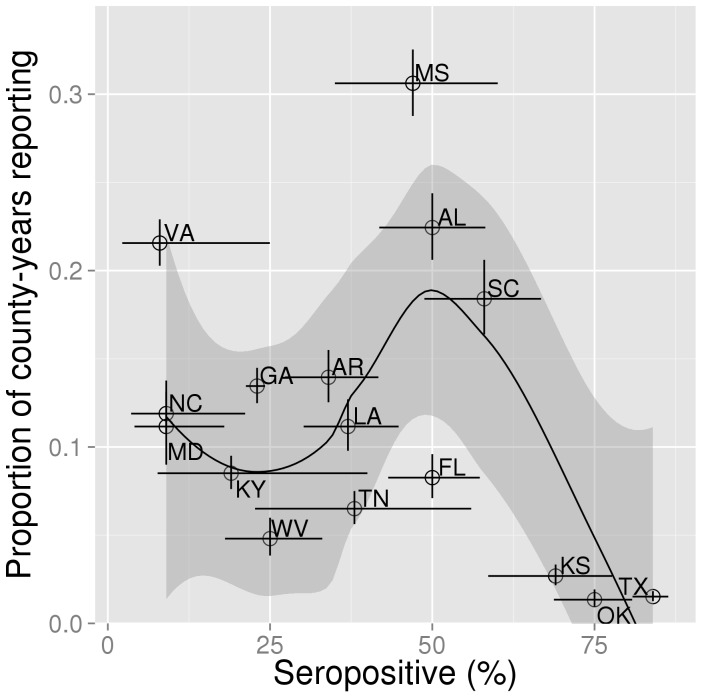
Figure 4. Amount of case reporting as a function of seroprevalence.
Proportion of 'county-years' reporting morbidity and/or mortality of HD as a function of seroprevalence in 16 US states. Open circles represent mean values. Error bars are 95% binomial confidence intervals. A loess model (span = 0.8) fitted to these data is also shown (solid black line). The shaded area around the fitted line is the 95% CI based on the standard errors of the locally weighted least squares regression using the t-based approximation.

