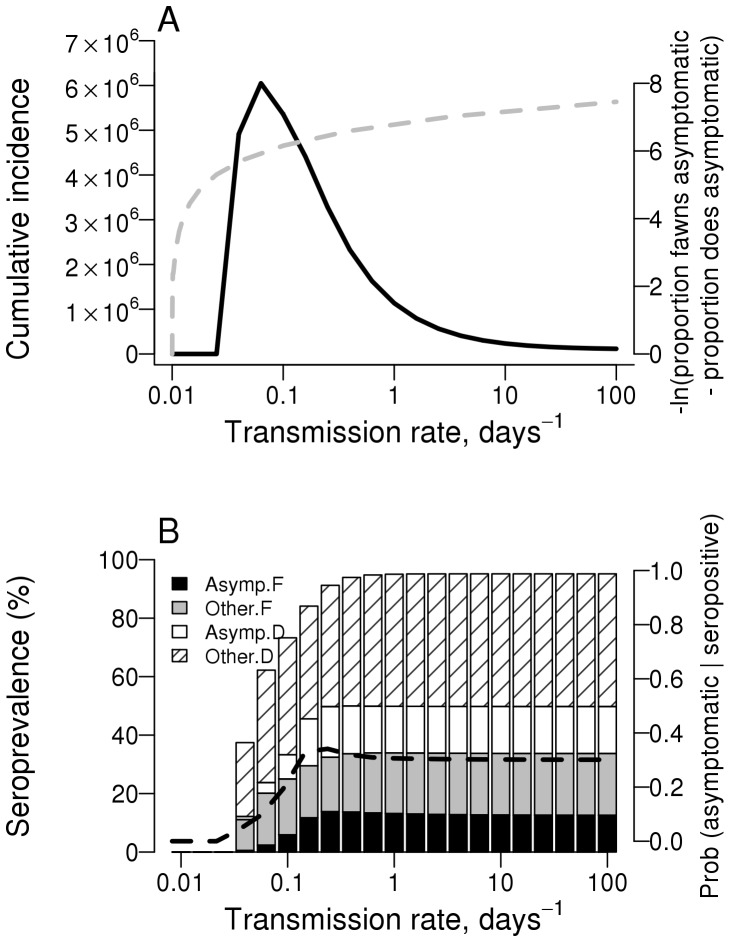
Figure 5. Model predictions for cumulative incidence and seroprevalence as a function of transmission intensity.
A: cumulative incidence (total number of symptomatic cases) over a 28-year simulation as a function of various transmission rates. B: Seroprevalence as a function of transmission rate and stratified by infected subpopulation: black bars = asymptomatically infected fawns, gray bars = all other seropositive fawns, white bars = asymptomatically infected does and striped bars = all other seropositive does. The dashed black line corresponds to the second y-axis and indicates the probability of currently being asymptomatically infected given a seropositive status. Default parameters as in Table 2.

