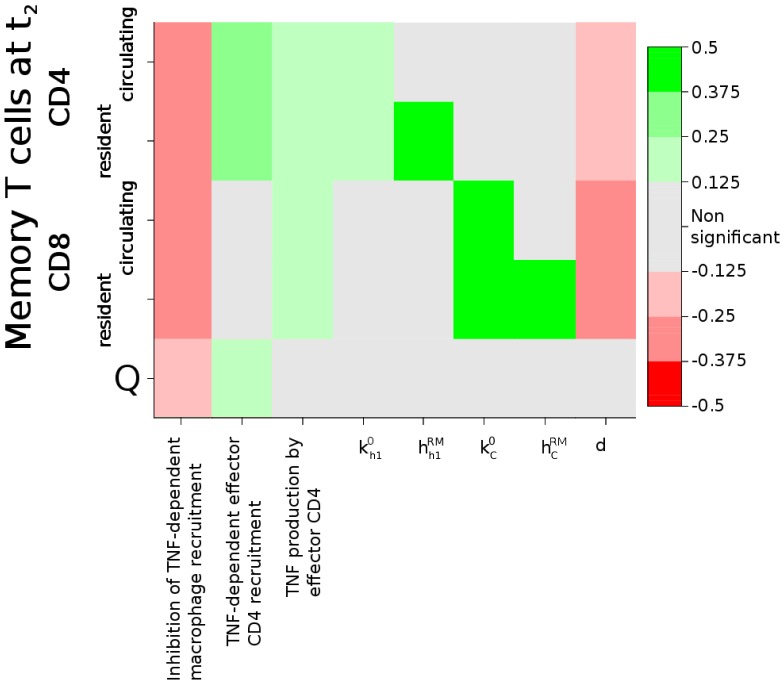
Figure 3. Results of the Uncertainty and Sensitivity analysis.
PRCC values for all parameters resulted significant against the target variables. Grey blocks indicate non-significant correlation. Green blocks indicate positive correlation, red blocks negative correlation. Parameters which have not been introduced in the text are described verbally rather than with the corresponding symbol.  : CD4+ specific immunogenic potential;
  : turnover rate of resident memory CD4+ T cells;
  : CD8+ specific immunogenic potential;
  : turnover rate of resident memory CD8+ T cells;
  : waning rate of circulating memory CD4+ and CD8+ T cells.

