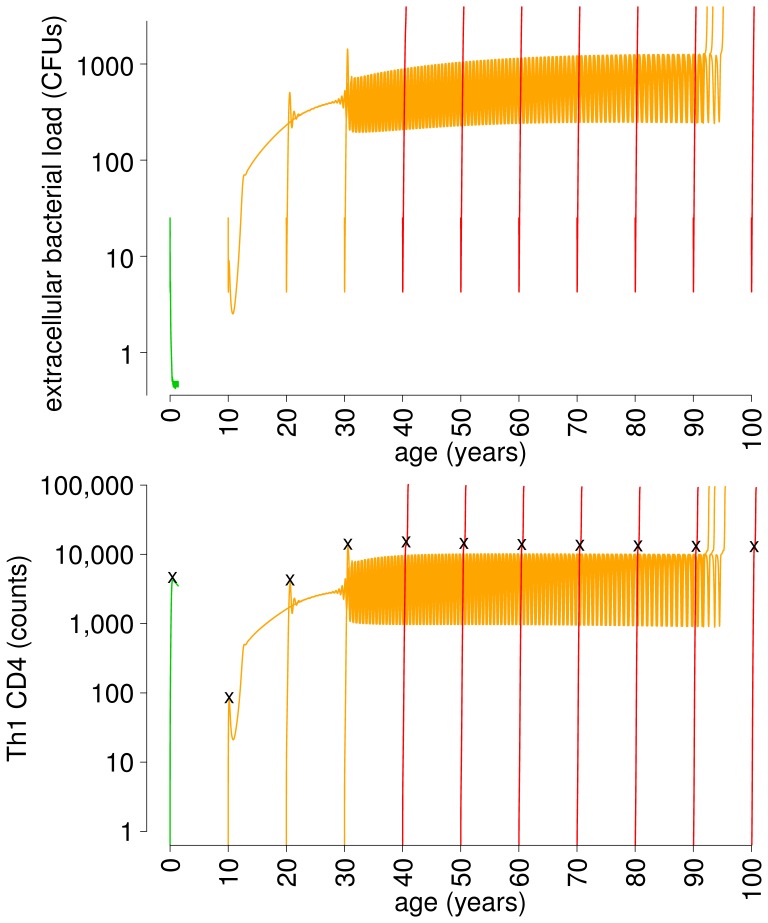
Figure 4. Endogenous reactivation.
Reproduction of endogenous reactivation. The simulation is performed by using the same inoculum of  bacteria at initial times of primary infection
  years and keeping the same set of immune parameters fixed (specified in Table S1 in File S1). Green: clearance of infection; orange: LTBI followed by reactivation; red: primary active disease. The oscillations in reactivation curves are not perfectly overlapping, but difference in oscillation phase are not visible at this time scale. In the lower panel, black marks indicate the number of T-helper type 1 (Th1) cells at the peak of the acute phase, a proportion of which is used to generate circulating memory T cells according to Equation 1. The number of T cells for infection at age 0 is only displayed until the time at which both extracellular and intracellular Mtb are cleared, after which the simulation is terminated.

