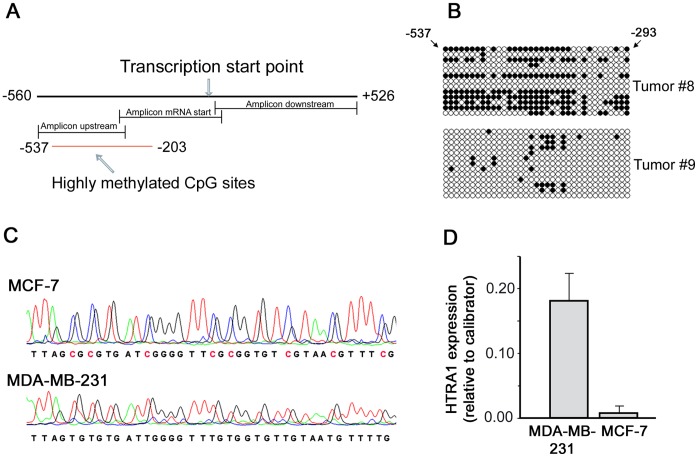
Figure 3. Methlylation analysis of the HTRA1 promoter.
A. Schematic illustration of the studied region covering nucleotides –560 to +526 relative to the transcription start site. The location of amplicons and of highly methylated CpG sites determined in this study is indicated. B. Methylation status of tumor samples #8 and #9: Potential CpG sites and the results of 13 analyzed clones in the amplicon upstream of the transcription start site are shown (black circles define methylated sites). The most distant CpG site is located at position −537, the most proximal site at position −293. C. Electropherograms obtained by genomic bisulfite sequencing of MCF-7 und MDA-MB-231 breast cancer cell lines. MCF-7 cells showed strong methylation of all CpG islands in the “upstream” region (shown here in part) and, as the only sample, in the first seven CpG-islands in the PCR fragment “mRNA start”. Methylated CpG sites are highlighted. No significant methylation was observed in MDA-MB-231 cells. D. Quantification of HTRA1 mRNA expression in two breast cancer cell lines. Relative HTRA1 expression levels, normalized to HPRT and adjusted to an ovarian cancer sample as calibrator, are shown in MCF-7 and MDA-MB-231 cells. SD values of two independent experiments are indicated. Mean difference in expression between both cell lines was 22-fold.

