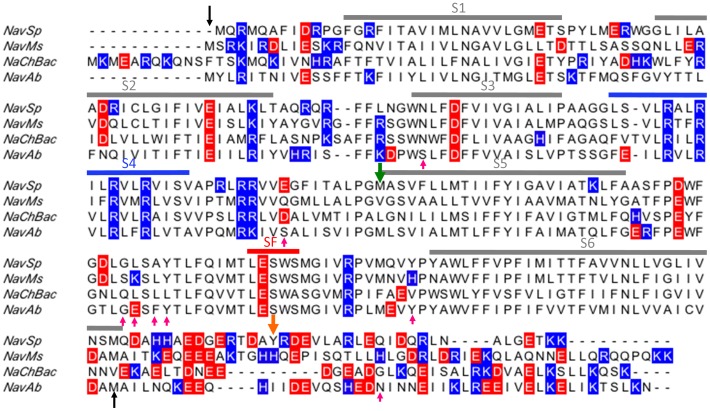
Figure 1. Sequence alignment of bacterial voltage-gated sodium channels.
The black arrows indicate the region visible in the NavAb crystal structure (PDBID 3RVY) which was used to create homology models of each channel. Positively charged residues are shown in blue, negatively charged residues in red. The pink upward arrows indicate residues within 5 Å of the phosphocholine headgroups observed in the NavAb crystal structures (PDBID 4EKW or 3RVY). The green downward arrow indicates the start of the pore-only constructs and the orange downward arrow indicates the site of the C-terminal truncation of the NavMs constructs.

