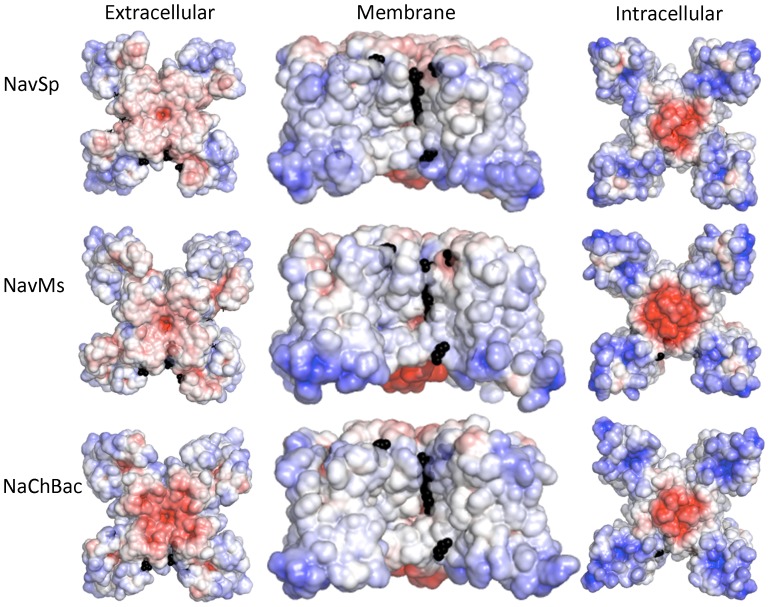
Figure 8. Model structures of the three homologues.
Comparison of the electrostatic potentials at +/−5 KT/e plotted on the solvent-accessible surfaces of (A) NavSp, (B) NavMs and (C) NaChBac, based on homology models constructed from NavAb in the activated closed state (PDBID:3RVY), viewed along the extracellular surface (left panel), the membrane normal (middle panel) and from the cytoplasmic surface (right panel). The black spheres indicate the positions of ordered lipids in the original NavAb (PDBID: 3RVY) crystal structure used to produce the models.

