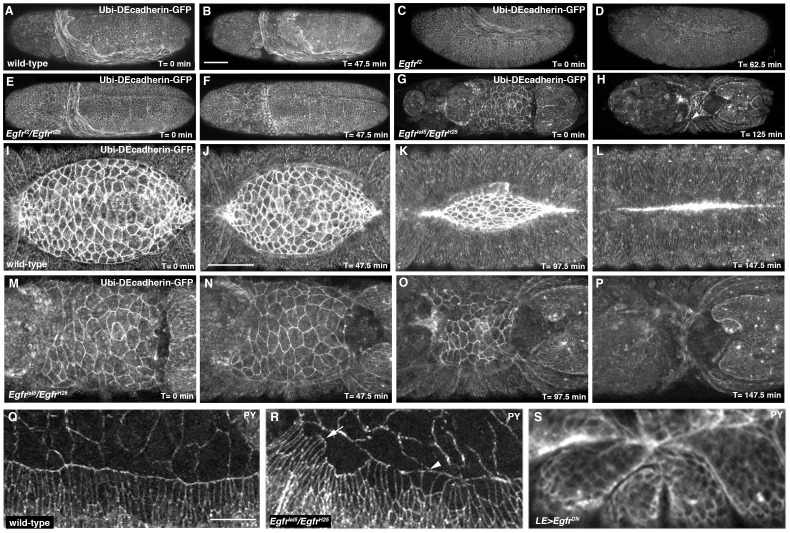
Figure 2. Impairment of Egfr signaling affects morphogenesis of the AS and dorsal epidermis.
(A, B) Still images from Movie S2 showing unfolding of the AS as germband retraction proceeds in a Ubi-DEcadherin-GFP-expressing embryo. (C, D) Still images from Movie S3 showing delayed germband retraction and disintegration of AS in Egfrf2 mutant embryo expressing Ubi-DEcadherin-GFP. (E, F) Still images from Movie S4 showing delayed germband retraction and disintegration of AS in Egfrf2/EgfrH25 mutant embryo expressing Ubi-DEcadherin-GFP. (G, H) Still images from Movie S5 showing bowing of Egfr1a15/EgfrH25 mutant, Ubi-DEcadherin-GFP-expressing embryo. Note bunching of segments (arrowhead in panel H). (I–L) Still images from Movie S6 showing morphogenesis of the AS in a Ubi-DEcadherin-GFP-expressing embryo. (M–P) Close-ups of dorsal surface in still images from Movie S5 showing defective AS morphogenesis in Egfr mutant embryo. Note that AS has fewer cells than wild-type and constricts perpendicular to the normal anterior-posterior direction. Note that the posterior end of the embryo moves anteriorly in progression from panel N to panel P as the embryo undergoes bowing. (Q-S) Confocal micrographs of dorsal epidermis of embryos stained with anti-phosphotyrosine. (Q) Wild-type embryo showing uniform shape of DME cells and fairly smooth leading edge. (R) Egfr1a15/EgfrH25 embryo showing considerable variation in shape of DME cells and jagged leading edge. Arrow marks a cluster of very constricted DME cells and arrowhead a cluster of cuboidal DME cells. (S) Embryo in which EgfrDN had been expressed using the LE-Gal4 driver showing bunching of segments. Scale bars: 50 µm (A–H)(I–P)(Q–S).

