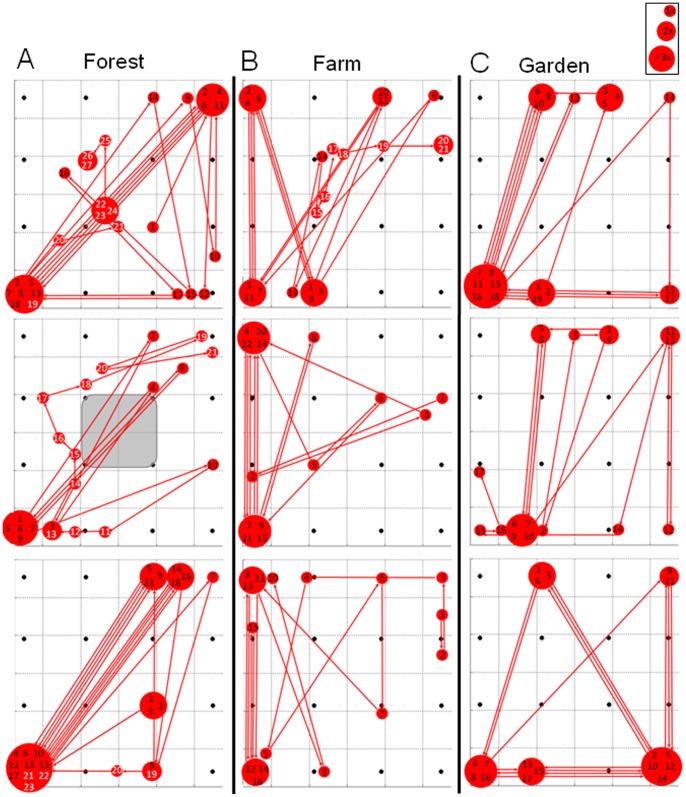
Figure 3. Scan paths at three edge habitat recording sites.
Scanning behavior during three typical flights at each of the three edge habitat recording sites. (A) forest road, (B) farm, (C) garden. The scanning behavior is indicated as pulse-to-pulse scan path of the calculated apparent or real beam maximum on the array plane. Successive pulses are identified by either black (search) or white (approach) numbers. The larger the circle around the numbers, the more calls were pointed at this spot. All beam maxima pictured on the outer edges of the array are apparent beam maxima; real maxima are within the array. The grey square at the forest site depicts the location where a single bat flew through the array.

