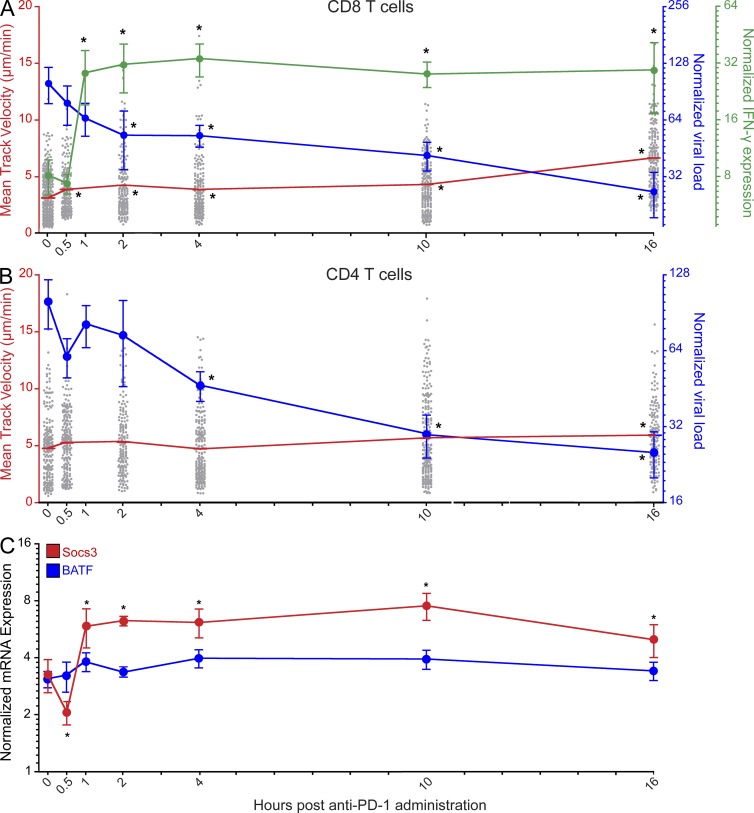
Figure 4.
Enhanced CD8 T cell motility precedes functional restoration and is associated with viral clearance. (A and B) Splenic mean track velocities of CD8+ P14 (A) and CD4+ SMARTA cells (B) in the red pulp (gray dots; red lines; n = 3–4 mice), IFN-γ expression (green line; n = 8 mice), and viral loads as determined by plaque assay (A) or Q-PCR (B; blue lines; n = 8 mice) were quantified at different time points after anti–PD-1 injection on day 7. Asterisks denote statistically significant differences (P < 0.05) from baseline (time point zero). Lines with error bars (green and blue) are plotted as mean ± SEM. The red lines for P14 and SMARTA cell motility represent the mean of each group. Each gray dot represents the track of an individual T cell. Data are representative of 2–4 independent experiments. (C) Socs3 (red) and BATF (blue) mRNA expression were quantified by Q-PCR at different time points after anti–PD-1 injection on day 7 (n = 8 mice). Asterisks denote statistically significant differences (P < 0.05) from baseline. Data are plotted mean ± SEM and are representative of two independent experiments.

