Figure 1.
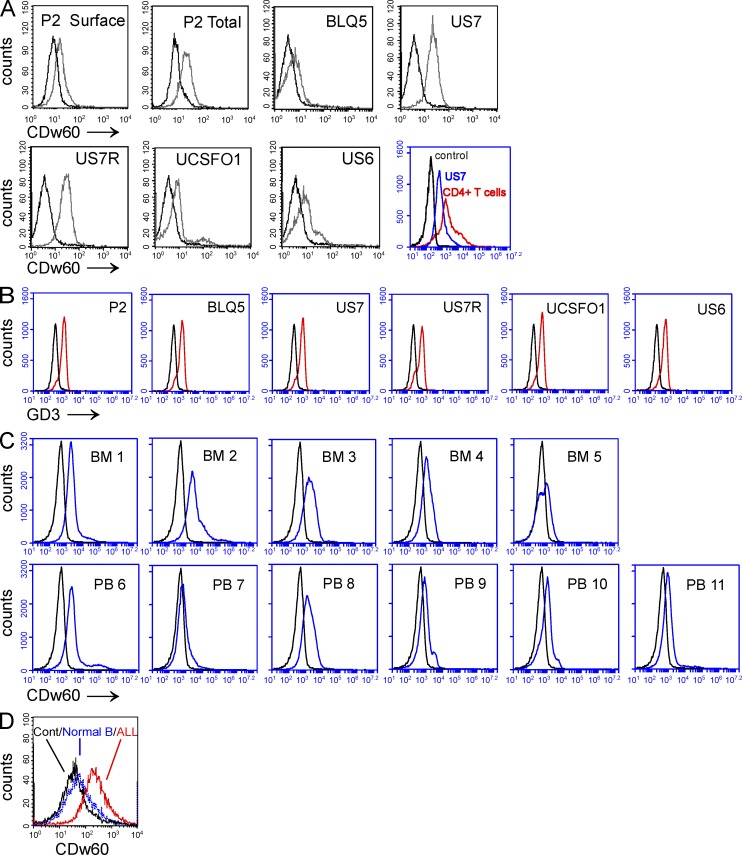
Expression of 9-O-Ac–GD3 in human pre-B ALL cells. (A) Presence of cell surface or total (intracellular + cell surface) 9-O-Ac–GD3 measured using FACS and antibodies against the CDw60 epitope, as exemplified by human relapse Ph-positive ALL P2 and total 9-O-Ac–GD3 expression in different human ALLs including Ph positive at relapse (BLQ5 and UCSFO1), Ph negative ALL (US6), and the same patient at presentation (US7) and relapse (US7R). The experiment was performed two times. Control: CD4-positive T cells gated out from PB of a normal donor and analyzed for 9-O-Ac–GD3 surface expression (red) compared with US7 ALL cells (blue) and isotype control (black). Gray lines indicate 9-O-Ac–GD3 staining. (B) Total GD3 expression in different ALL cells, control (black) and GD3 staining (red). (C) Cell surface expression of 9-O-Ac–GD3 in CD19+, CD10+ pre-B cells from BM and PB from ALL patients, as detected by the anti-CDw60 antibody. (D) CDw60 staining in primary CD19+, CD10+, sIgM− pre-B cells from the BM of a normal donor (blue), ALL patient (red), and isotype control (black). B–D show single experiments.

