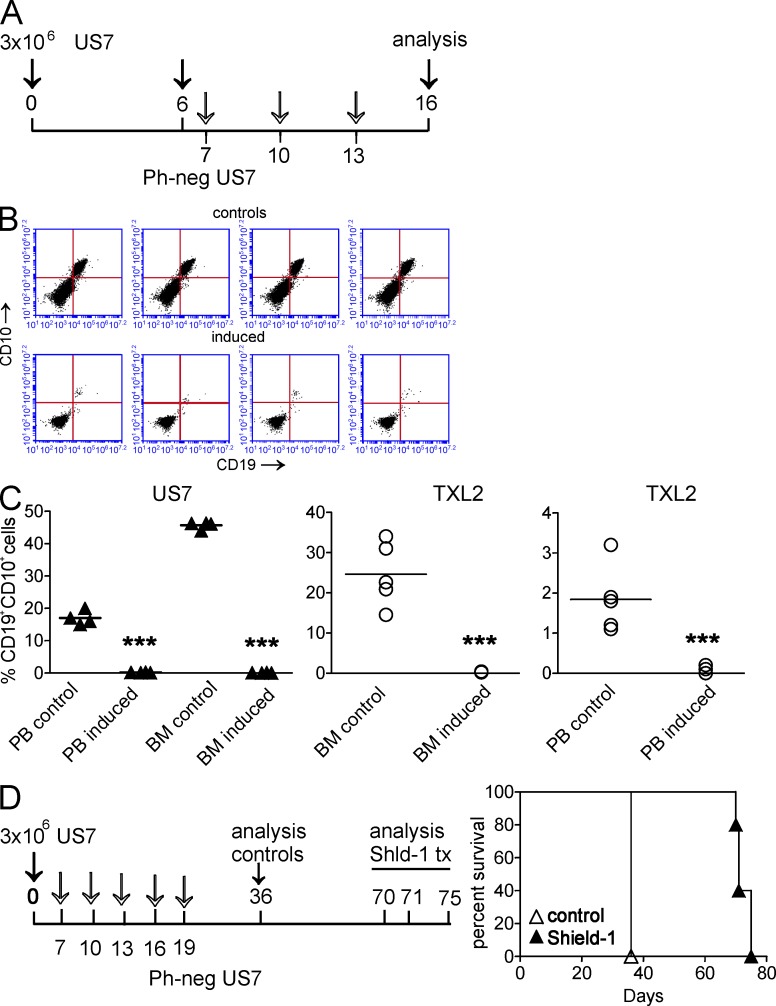
Figure 10.
Induced expression of 9-O-acetylesterase in vivo causes ALL cell death. (A) Schematic illustration of treatment of US7-transplanted mice. Induction of 9-O-acetylesterase was on days 7, 10, and 13 with 10 mg/kg Shield-1. (B) FACS analysis showing human CD19 and CD10 expression on BM cells isolated from control mice or Shield-1–injected mice, transplanted with US7 cells transduced with the inducible O-acetylesterase gene. (C) Graphs showing the percentage of human CD19, CD10 double-positive cells in PB and BM of control as well as esterase-induced mice. Each in vivo experiment was performed once with four to five mice/group. For details on the TXL2 experiment, see Materials and methods. Horizontal bars indicate mean. ***, P < 0.001 for BM and PB control compared with induced. (D, left) Schematic illustration of treatment of US7-transplanted mice for long-term survival. Induction of 9-O-acetylesterase was as indicated by open arrows on days 7, 10, 13, 16, and 19 with 10 mg/kg Shield-1. (right) Survival of mice treated with vehicle or Shield-1. Significance was calculated by Log-rank Mantel-Cox test. P = 0.0027 for controls compared with Shield-1–treated mice. The experiment was performed once with five mice/group.

