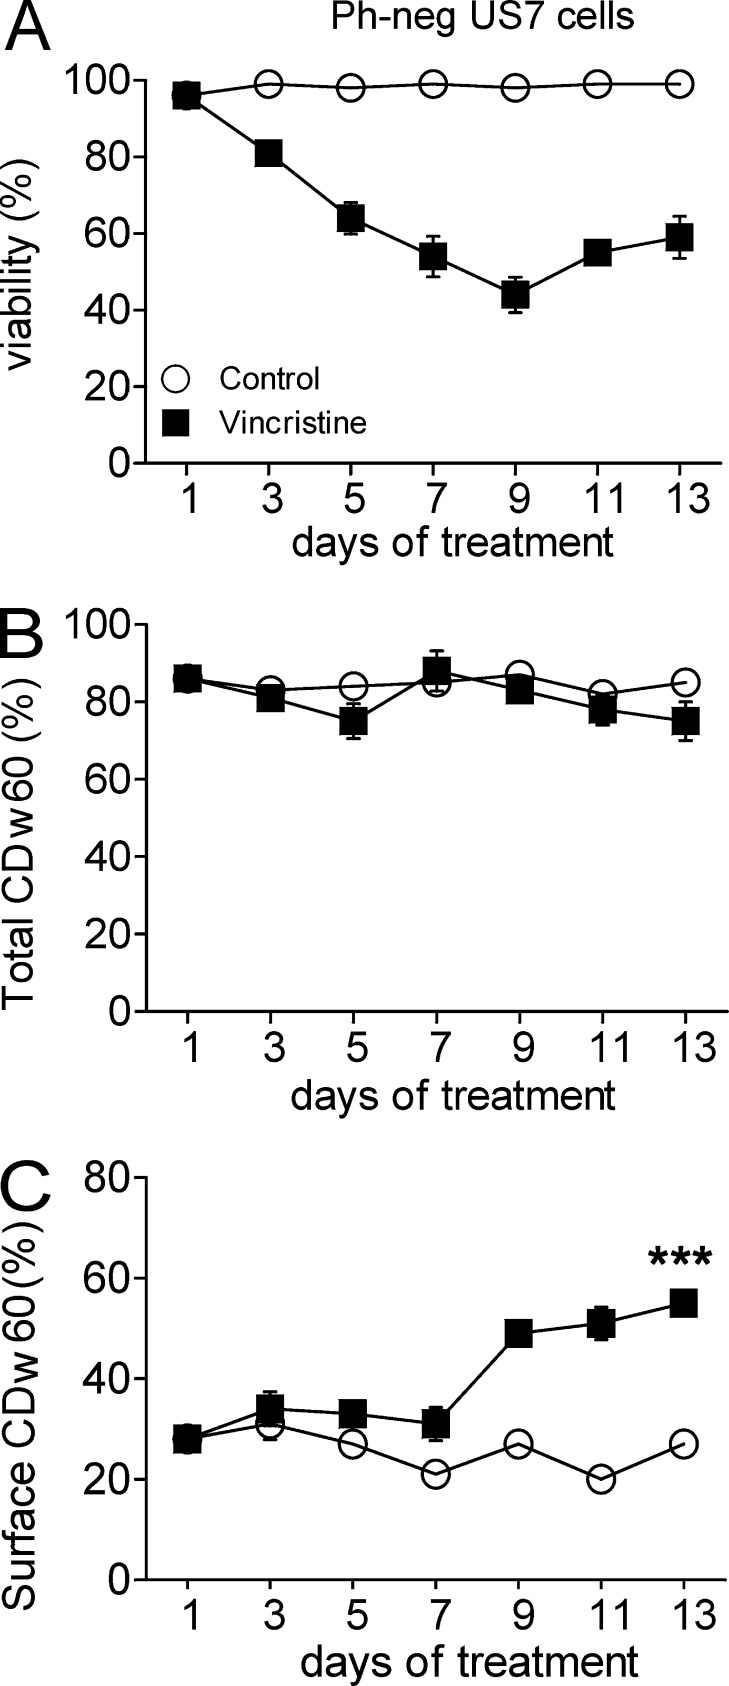
Figure 5.
Increased cell surface expression of 9-O-Ac–GD3 correlates with the development of drug resistance. US7 cells on stroma treated with vehicle or 2.5 nM vincristine. Fresh drug was added every second day with fresh medium. (A) Viability of the culture. (B and C) Percentage of cells positive for total CDw60 (B) or cell surface CDw60 (C) as measured by FACS. The experiment was performed twice independently on triplicate samples. Surface CDw60 on day 13 control compared with vincristine: ***, P < 0.001. Error bars show the standard deviation of triplicate samples.

