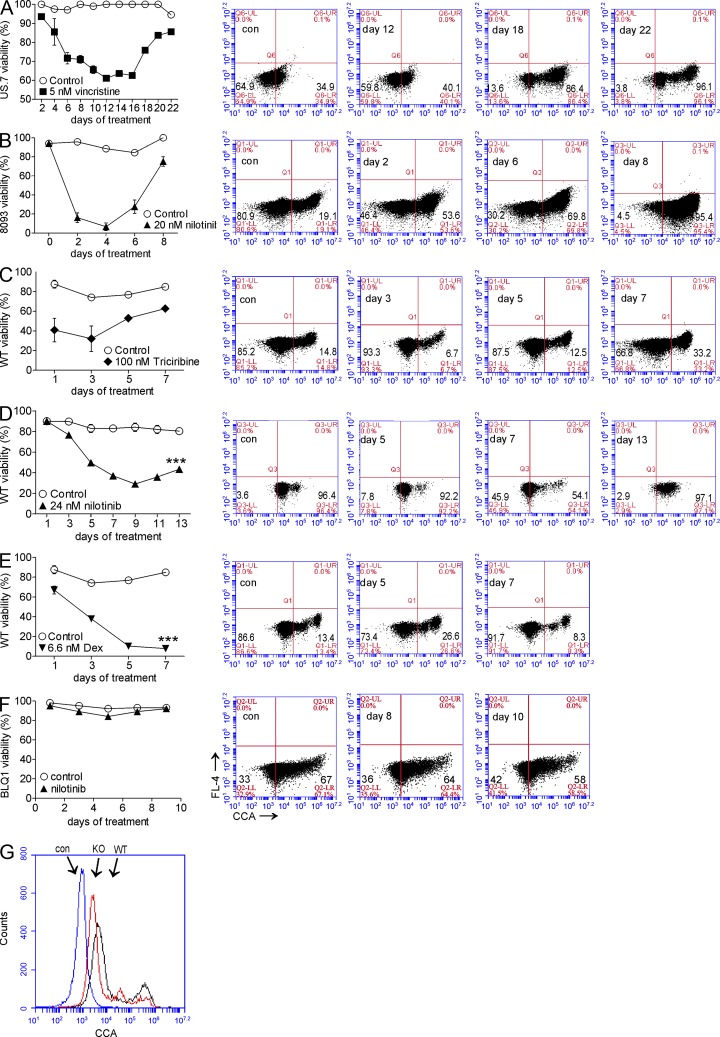
Figure 6.
CCA lectin binding to ALL cells increases during development of drug resistance. (A–F, left) Percent viability. (right) FACS dot plot analysis showing surface CCA lectin binding of US7 cells treated with 5 nM vincristine (A), transgenic mouse 8093 pre-B ALL cells treated with 20 nM nilotinib (B), WT BCR/ABL pre-B ALL cells treated with 100 nM triciribine (C), 24 nM nilotinib (D), or 6.6 nM dexamethasone (E). ***, P < 0.001. (F) BLQ1 Ph-positive human ALL cells containing Bcr/Abl with a T315I mutation treated with 24 nM nilotinib. (G) Cell surface CCA lectin binding to GD3 synthase KO BCR/ABL-transduced cells, WT BCR/ABL-transduced cells, and unstained control cells as indicated. All experiments were performed two to three times. Error bars show the standard deviation of triplicate samples.

