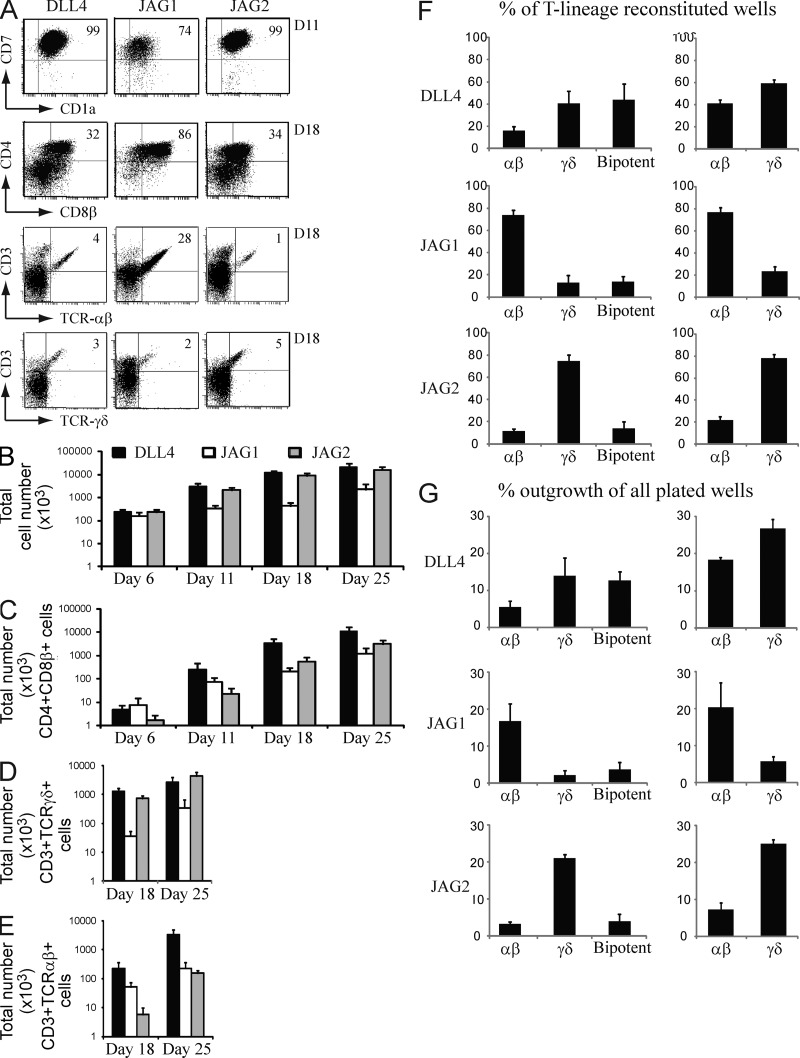
Figure 1.
Notch ligands differentially impact TCR-αβ versus TCR-γδ T cell development. (A) Kinetic flow cytometric analysis of CD34+CD4−CD1a− uncommitted intrathymic progenitors cultured for 11 or 18 d on OP9 cells expressing the different Notch ligands (DLL4, JAG1, or JAG2) as indicated above the dot plots. Numbers in the quadrants indicate the percentage of the corresponding populations. Dot plots shown are representative of three independent experiments. (B–E) Corresponding cell numbers of the kinetic flow cytometric analysis of cultures depicted in A. Graphs show the absolute number of all cells (B), CD4+CD8β+ DP cells (C), CD3+TCR-γδ+ (D), and CD3+TCR-αβ+ cells (E). Data shows the mean of three independent experiments and error bars show SEM. (F and G) Relative (F) or absolute (G) frequency of αβ-only, γδ-only, or bipotent αβ- and γδ-containing wells (left graphs) or frequency of TCR-αβ or TCR-γδ T cell–containing wells (right graphs) within single-plated CD34+CD4–CD1a+ T-lineage committed thymocytes on the different OP9 cell lines, as indicated in the graph, that showed T cell reconstitution after 20 d of coculture. Data shows the mean of three independent experiments and error bars show SEM.

