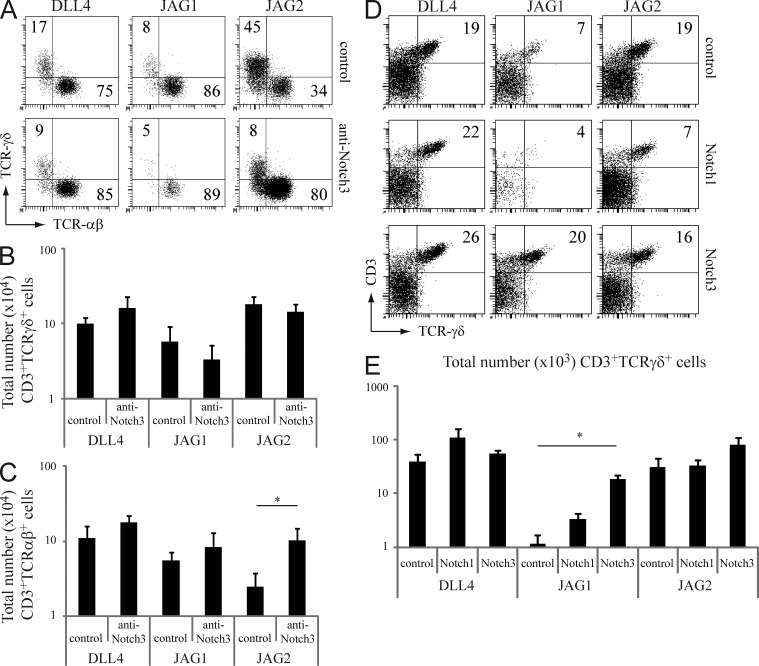
Figure 6.
Notch3 signaling is an important driver of human γδ T cell differentiation. (A) Flow cytometric analysis of CD34+CD4−CD1a− thymocytes after 4 wk of coculture on OP9 stromal cells that express the various Notch ligands and in the presence of control or blocking anti-Notch3 antibody, showing TCR-αβ and TCR-γδ staining of CD3+ gated thymocytes. Numbers in dot plots indicate the percentage of cells for the corresponding populations. (B) Absolute number of TCR-γδ T cells generated in cultures shown in A. (C) Absolute number of TCR-αβ T cells generated in cultures shown in A. Data are the mean from five independent experiments (errors bars indicate SEM, * = P < 0.05). (D) Flow cytometric analysis of CD34+CD4−CD1a− thymocytes, transduced with control or full-length Notch1 (FLN1) or full-length Notch3 (FLN3), and cocultured for 3 wk on OP9 cells expressing the different Notch ligands (DLL4, Jagged1, or Jagged2) as indicated. Numbers in dot plots show the frequency of TCR-γδ T cells. Data are representative of three independent experiments. (E) Absolute number of TCR-γδ T cells generated from cultures shown in D. Data are derived from three independent experiments (errors bars indicate SEM, * = P < 0.05).

