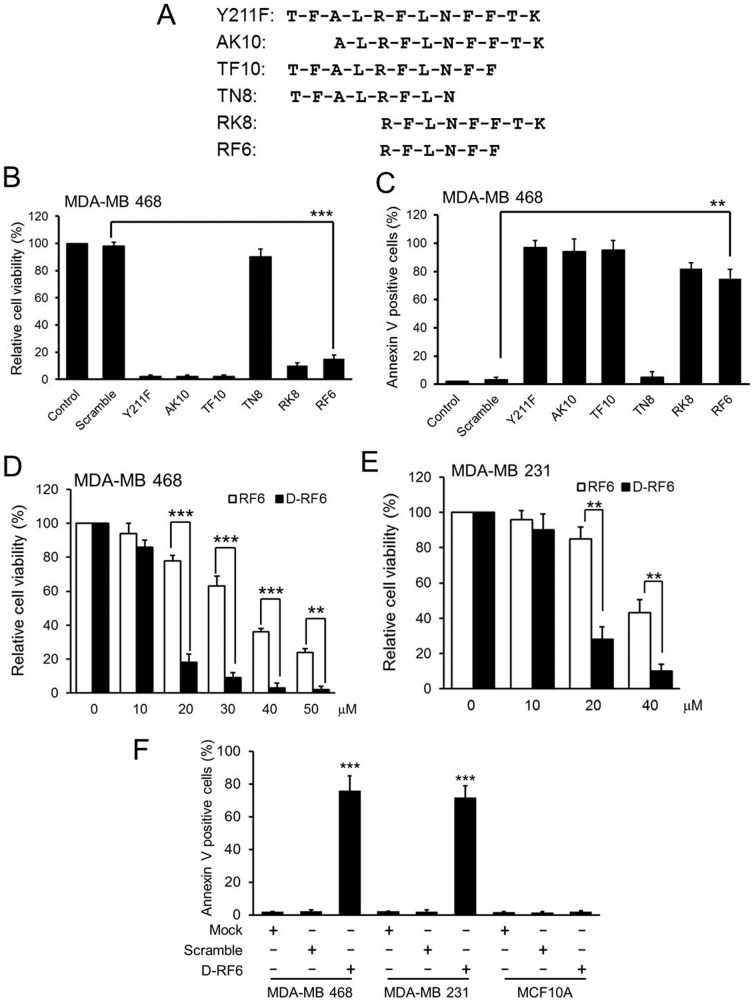
Figure 4. The cytotoxic effect of different CPPP derivatives in TNBC cells.
(A) The schematic illustrates the amino acid sequence of each CPPP derivative. (B–C) MDA-MB 468 cells were individually treated with 50 µM of each CPPP derivative for 24 h, and then the relative cell viability (B) and Annexin V-positive cells (C) were determined. (E–F) MDA-MB 468 (E) or MDA-MB 231 (F) cells were treated with indicated concentrations of RF6 CPPP or D-RF6 CPPP for 24 h, and the relative cell viability was examined. (G) The percentage of the apoptotic cells from each TNBC cell line after 24 h treatment with 15 µM of Mock (PBS), Scramble and D-RF6 were determined by flow cytometry of Annexin V-positive cells. The bars indicate mean ± S.D.; **, p<0.01; ***, p<0.001 by t-test.

