
Figure 3.
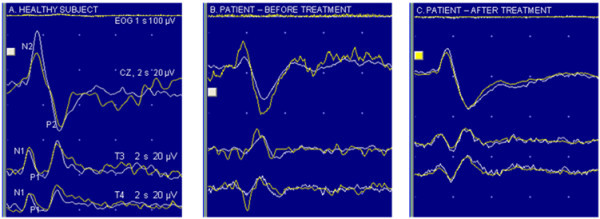
Laser evoked potentials after stimuli on left trigeminal (V1) area in one healthy subject (A) and in one patient (before and after treatment; B and C respectively); white lines (EOG, CZ, T3 and T4) show the average of the first 15 recordings, yellow lines show the average of the last 15 recordings.