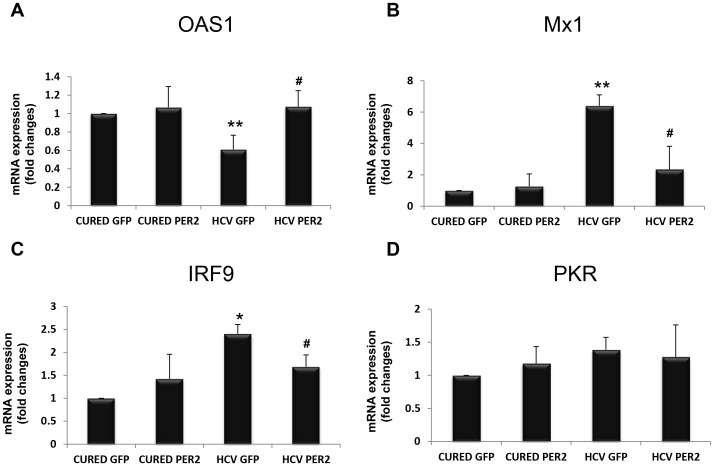
Figure 3. qRT-PCR analysis of interferon stimulated genes (ISGs: OAS1, Mx1, IRF9, PKR) mRNAs expression levels in control (cured) OR6 cells and HCV replicating OR6 cells electroporated with GFP (cured GFP, HCV GFP) or with Flag-PER2 (cured PER2, HCV PER2) A, B, C and D.
mRNA was extracted 24 hours after electroporation with the respective constructs and ISGs levels were normalized to TBP as housekeeping gene. Results are expressed as means ± SE of three independent experiments. * = p<0.05, ** = p<0.01 in HCV replicating OR6 cells overexpressing GFP versus OR6 control cells overexpressing GFP or Flag-PER2. # = p<0.05 in HCV replicating OR6 cells overexpressing Flag-PER2 versus HCV replicating OR6 cells overexpressing GFP.

