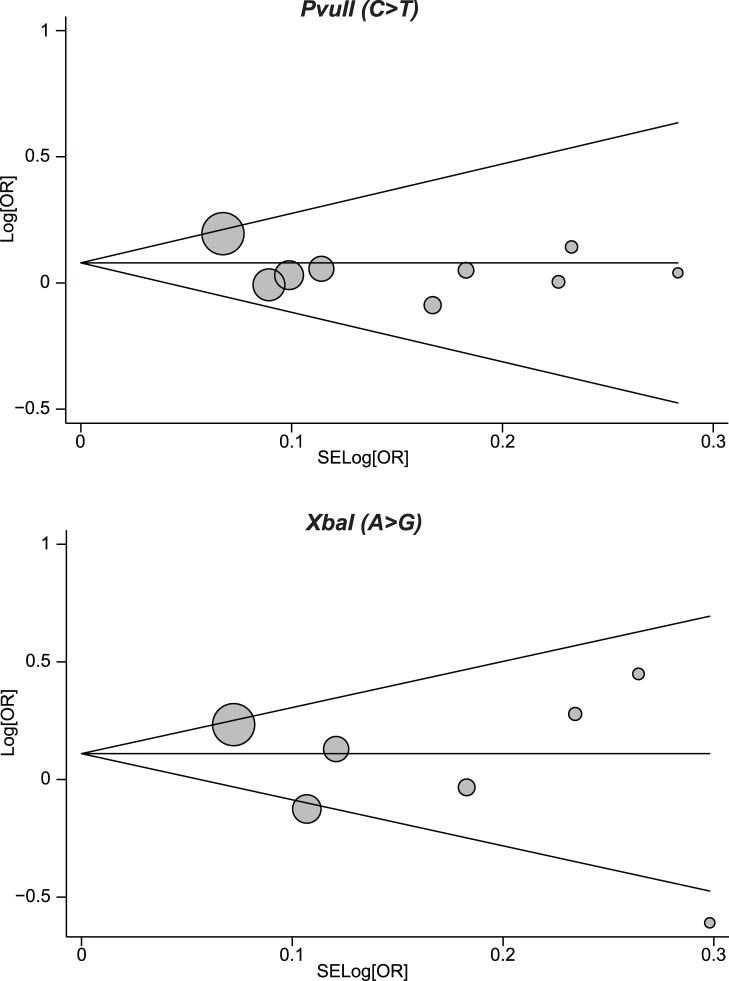
Figure 4. Begger’s funnel plot of the meta-analysis of ESR1 PvuII and XbaI polymorphisms and endometrial cancer risk.
Each point represents a separate study for the indicated association. Log[OR], natural logarithm of OR. Horizontal line, mean magnitude of the effect. Note: Funnel plot with pseudo 95% confidence limits was used.

