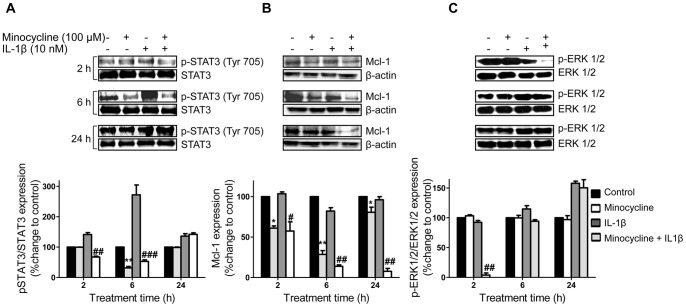
Figure 5. Influence of minocycline on p-STAT3, p-ERK1/2 and Mcl-1 expression in ovarian cancer cells.
SKOV-3 cells were treated with minocycline (100 µM) with or without IL-1β (10 ng/ml) stimulation for different time points. The expression levels of (A) p-STAT3, STAT3; (B) Mcl-1 or (C) p-ERK1/2, ERK1/2 were estimated by western blot analysis. Densitometric analysis is expressed as mean ± SD intensity of optical density obtained by three independent experiments (*p<0.05, **p<0.01 and ***p<0.001 vs. control cells, # p<0.05, ## p<0.01 vs. IL-1β treated cells).

