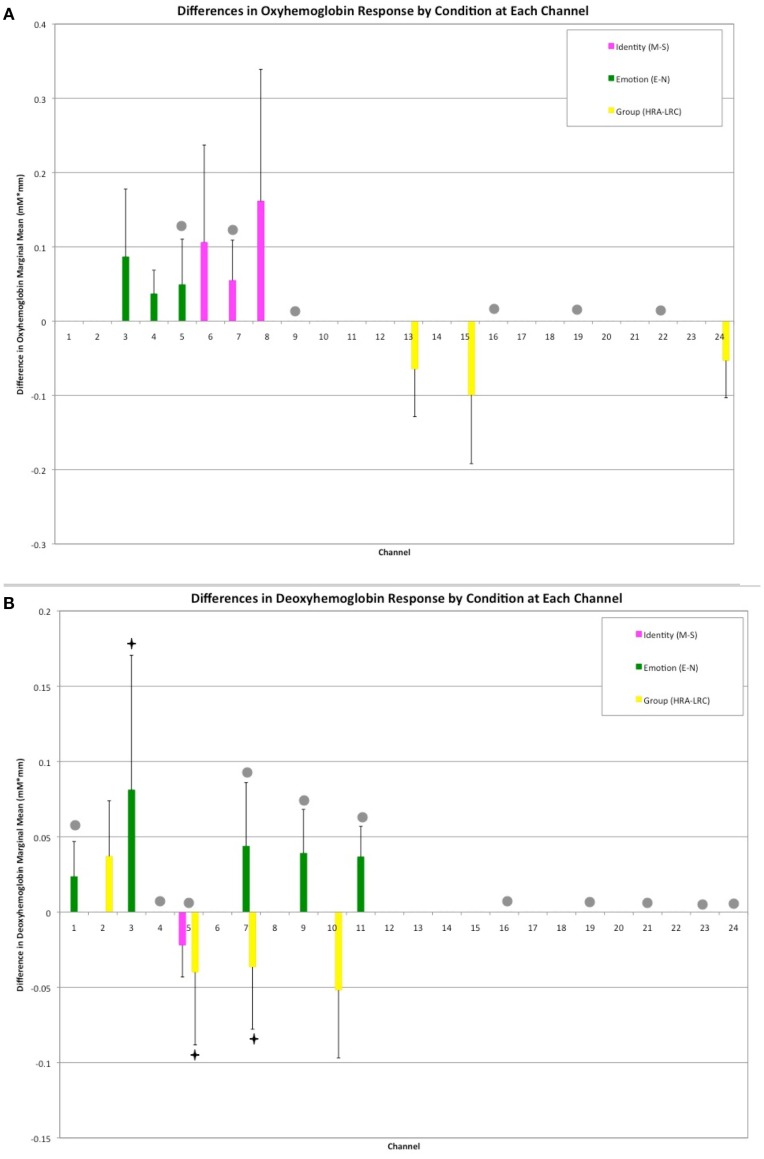
Figure 2.
Results of Face Identity × Emotion × Group ANOVA by Channel. (A) Difference in Oxy-hemoglobin Response; (B) Difference in Deoxy-hemoglobin Response. (M = Mother, S, Stranger; E, Emotion; N, Neutral; HRA, High-Risk Autism; LRC, Low-risk Control). Channels with significant main effects of Face Identity (magenta) and Emotion (green) occurred in frontal regions, while the main effect of Group was seen in right lateral channels (yellow). The difference in population marginal means with corresponding 95% confidence intervals, Tukey’s HSD used for correction for multiple comparisons. Bonferroni correction was employed for correction of comparisons across channels. Marginally significant effects are indicated by “♦” (full statistics in Table A1 in Appendix). Significant interactions were seen across frontal and lateral channels (gray circles). Further information regarding interactions is available in Table 1.

