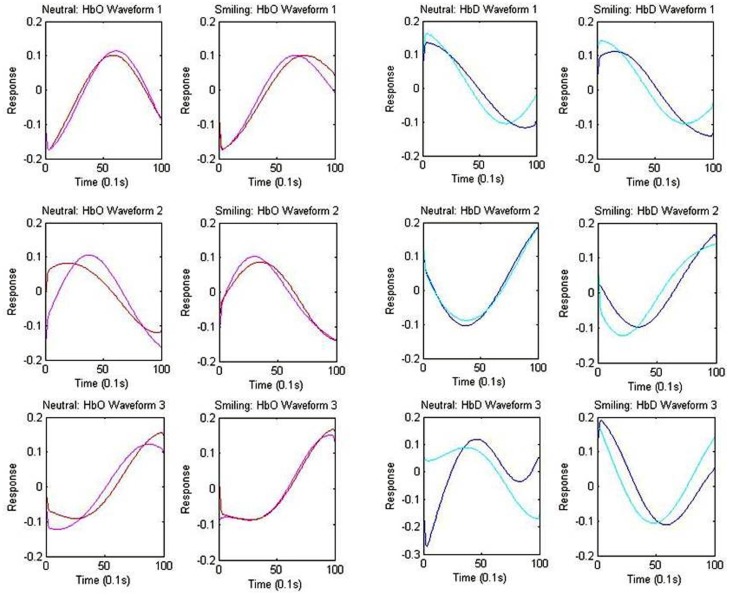
Figure 5.
Centroid Waveforms of Component Clusters. Each waveform (centroid) is the mean of the components of the cluster, after centering and normalizing points to zero mean and unit standard deviation. Three waveforms were obtained for each of the oxy-hemoglobin (HbO: red = HRA, pink = LRC) and deoxy-hemoglobin (HbD: blue = HRA, cyan = LRC) components, for both the smiling and neutral conditions. Waveforms from the HRA and LRC groups are shown together based upon correlation.

